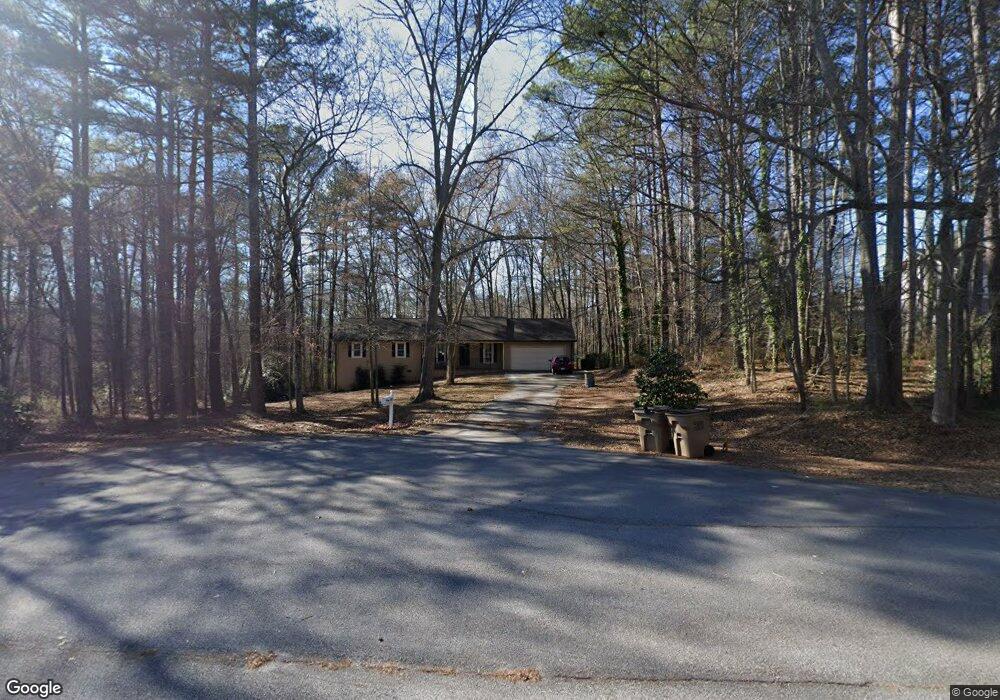
105 Indian Pass Stockbridge, GA 30281
Estimated Value: $213,599 - $252,000
3
Beds
2
Baths
1,437
Sq Ft
$165/Sq Ft
Est. Value
About This Home
This home is located at 105 Indian Pass, Stockbridge, GA 30281 and is currently estimated at $236,900, approximately $164 per square foot. 105 Indian Pass is a home located in Henry County with nearby schools including Cotton Indian Elementary School, Stockbridge Middle School, and Stockbridge High School.
Ownership History
Date
Name
Owned For
Owner Type
Purchase Details
Closed on
Oct 19, 2016
Sold by
Lhp Investments Inc
Bought by
Amos Brandon and Johnson Amos Cornethia
Current Estimated Value
Home Financials for this Owner
Home Financials are based on the most recent Mortgage that was taken out on this home.
Original Mortgage
$109,872
Outstanding Balance
$87,831
Interest Rate
3.37%
Mortgage Type
FHA
Estimated Equity
$149,069
Purchase Details
Closed on
Jun 27, 2016
Sold by
Nationstar Mtg Llc
Bought by
Lhp Investments Inc
Purchase Details
Closed on
May 3, 2016
Sold by
Perricone Eric
Bought by
Nationstar Mtg Llc
Purchase Details
Closed on
May 28, 2008
Sold by
Stone Shirley A
Bought by
Perricone Eric
Home Financials for this Owner
Home Financials are based on the most recent Mortgage that was taken out on this home.
Original Mortgage
$111,853
Interest Rate
5.86%
Mortgage Type
FHA
Create a Home Valuation Report for This Property
The Home Valuation Report is an in-depth analysis detailing your home's value as well as a comparison with similar homes in the area
Home Values in the Area
Average Home Value in this Area
Purchase History
| Date | Buyer | Sale Price | Title Company |
|---|---|---|---|
| Amos Brandon | $111,900 | -- | |
| Lhp Investments Inc | $71,220 | -- | |
| Nationstar Mtg Llc | $73,100 | -- | |
| Perricone Eric | $116,000 | -- |
Source: Public Records
Mortgage History
| Date | Status | Borrower | Loan Amount |
|---|---|---|---|
| Open | Amos Brandon | $109,872 | |
| Previous Owner | Perricone Eric | $111,853 |
Source: Public Records
Tax History Compared to Growth
Tax History
| Year | Tax Paid | Tax Assessment Tax Assessment Total Assessment is a certain percentage of the fair market value that is determined by local assessors to be the total taxable value of land and additions on the property. | Land | Improvement |
|---|---|---|---|---|
| 2025 | $2,485 | $100,160 | $12,000 | $88,160 |
| 2024 | $2,485 | $91,840 | $12,000 | $79,840 |
| 2023 | $1,906 | $90,720 | $10,000 | $80,720 |
| 2022 | $1,866 | $67,840 | $8,000 | $59,840 |
| 2021 | $1,736 | $62,440 | $8,000 | $54,440 |
| 2020 | $1,583 | $56,000 | $8,000 | $48,000 |
| 2019 | $1,452 | $50,520 | $8,000 | $42,520 |
| 2018 | $1,362 | $46,760 | $8,000 | $38,760 |
| 2016 | $1,016 | $32,520 | $6,000 | $26,520 |
| 2015 | $759 | $25,480 | $4,800 | $20,680 |
| 2014 | $640 | $22,360 | $4,800 | $17,560 |
Source: Public Records
Map
Nearby Homes
- 110 Stagecoach Trail
- 176 Southern Magnolia Ln
- 68 Pine Dr
- 102 Hayes Cir
- 6435 Cumberland Dr
- 6495 Old MacOn Hwy
- 3920 Augustine Place
- 3844 Augustine Place
- 6324 Amberly Rd
- 3832 Augustine Place
- 3824 Augustine Place
- 813 Abarca Ln
- 805 Abarca Ln
- 809 Abarca Ln
- 5904 Foxfield Trail
- 6710 Sunset Hills Blvd
- 7001 Coatsworth Dr Unit LOT 1
- 103 Indian Pass
- 107 Indian Pass
- 113 Stagecoach Trail
- 104 Indian Pass
- 1039 Stagecoach Rd
- 115 Stagecoach Trail
- 1041 Stagecoach Rd
- 112 Stagecoach Trail
- 190 Stagecoach Ridge
- 117 Stagecoach Trail
- 114 Stagecoach Trail
- 116 Stagecoach Trail
- 1027 Stagecoach Rd
- 180 Stagecoach Ridge
- 121 Stagecoach Trail
- 1009 Stagecoach Rd
- 1083 Stagecoach Rd
- 971 Stagecoach Rd
- 123 Stagecoach Trail
- 1073 Stagecoach Rd