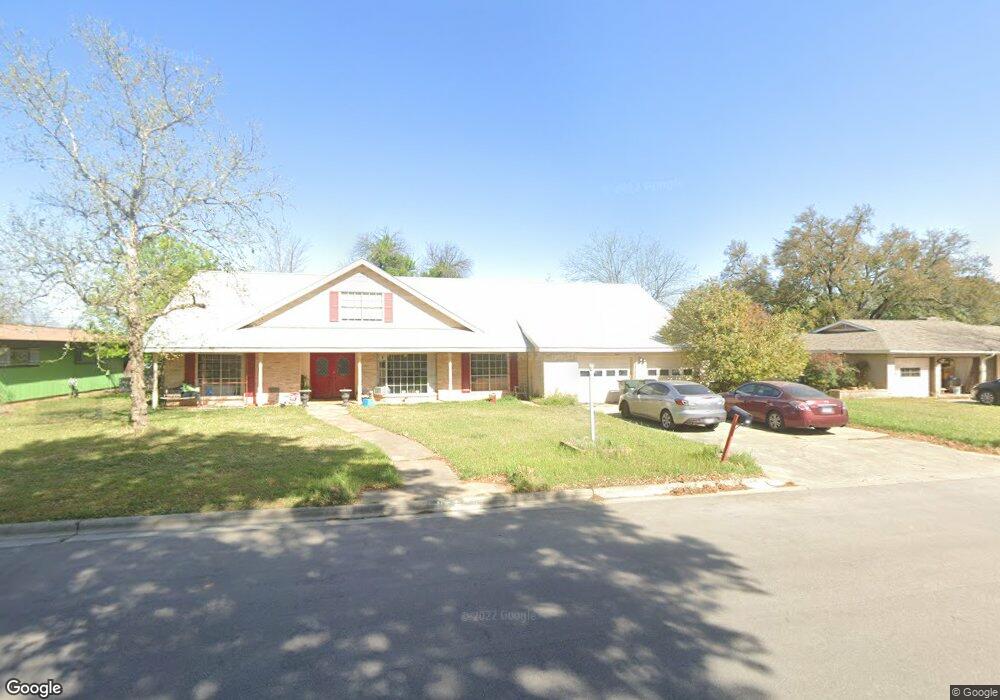
105 Oakridge Dr San Marcos, TX 78666
Estimated Value: $377,000 - $612,000
--
Bed
--
Bath
3,769
Sq Ft
$137/Sq Ft
Est. Value
About This Home
This home is located at 105 Oakridge Dr, San Marcos, TX 78666 and is currently estimated at $514,935, approximately $136 per square foot. 105 Oakridge Dr is a home located in Hays County with nearby schools including Crockett Elementary School, Dorris Miller Middle School, and San Marcos High School.
Ownership History
Date
Name
Owned For
Owner Type
Purchase Details
Closed on
Oct 25, 2019
Sold by
Wexler Aldridge Hammar and Wexler Bradley A
Bought by
Martinez Angelica Alegria and Aldridge Hammar Wexler & Bradley P A
Current Estimated Value
Purchase Details
Closed on
May 21, 2015
Sold by
Bradley Patricia
Bought by
Martinez Angelica Alegria and Diaz Angelica
Purchase Details
Closed on
Jul 22, 2011
Sold by
Kowalik Calvin Ray and Kowalik Jennifer Rene Donnell
Bought by
Reynolds Charles P and Angelica Diaz Irrevocable Trust
Purchase Details
Closed on
May 25, 2005
Sold by
Pitzer R Knox and Pitzer Eleanor
Bought by
Kowalik Calvin R
Home Financials for this Owner
Home Financials are based on the most recent Mortgage that was taken out on this home.
Original Mortgage
$206,000
Interest Rate
5.25%
Mortgage Type
Fannie Mae Freddie Mac
Create a Home Valuation Report for This Property
The Home Valuation Report is an in-depth analysis detailing your home's value as well as a comparison with similar homes in the area
Home Values in the Area
Average Home Value in this Area
Purchase History
| Date | Buyer | Sale Price | Title Company |
|---|---|---|---|
| Martinez Angelica Alegria | -- | None Available | |
| Martinez Angelica Alegria | -- | None Available | |
| Reynolds Charles P | -- | Fidelity National Title | |
| Kowalik Calvin R | -- | Fnt |
Source: Public Records
Mortgage History
| Date | Status | Borrower | Loan Amount |
|---|---|---|---|
| Previous Owner | Kowalik Calvin R | $206,000 |
Source: Public Records
Tax History Compared to Growth
Tax History
| Year | Tax Paid | Tax Assessment Tax Assessment Total Assessment is a certain percentage of the fair market value that is determined by local assessors to be the total taxable value of land and additions on the property. | Land | Improvement |
|---|---|---|---|---|
| 2025 | $9,194 | $655,740 | $91,120 | $564,620 |
| 2024 | $9,194 | $667,320 | $91,120 | $576,200 |
| 2023 | $13,328 | $700,740 | $91,120 | $609,620 |
| 2022 | $11,738 | $572,810 | $59,400 | $513,410 |
| 2021 | $9,035 | $409,900 | $50,490 | $359,410 |
| 2020 | $7,163 | $325,000 | $50,490 | $274,510 |
| 2019 | $9,725 | $395,060 | $50,490 | $344,570 |
| 2018 | $8,544 | $345,490 | $16,320 | $329,170 |
| 2017 | $7,983 | $332,030 | $16,320 | $315,710 |
| 2016 | $7,474 | $310,850 | $16,320 | $294,530 |
| 2015 | $6,524 | $293,520 | $16,320 | $277,200 |
Source: Public Records
Map
Nearby Homes
- 71 Elm Hill Ct
- 2 Tanglewood Trail
- 103 Sierra Ridge Dr
- 806 Sagewood Trail Unit 808
- 903 Sagewood Trail Unit 905
- 118 Yaupon Ct
- 105 Yaupon Ct
- 211 Ridgewood Dr
- 1013 Chestnut St
- 1013 Chestnut St Unit 6
- 1013 Chestnut St Unit Building C, Unit 5
- 1013 Chestnut St Unit 4
- 905 N Lbj Dr
- 206 Yale St
- 135 Eastwood Ln
- 205 Hughson Dr
- 114 Algarita St
- 0 Old Ranch Road 12
- 1102 Academy St
- 140 Coers Dr
- 105 Oak Ridge Dr
- 103 Oakridge Dr
- 107 Oak Ridge Dr
- 107 Oakridge Dr
- 104 Oak Ridge Dr
- 106 Oakridge Dr
- 109 Oakridge Dr
- 101 Oakridge Dr
- 104 Oakridge Dr
- 108 Oakridge Dr
- 108 Oak Ridge Dr
- 110 Oakridge Dr
- 102 Oakridge Dr
- 111 Oak Ridge Dr
- 111 Oakridge Dr
- 105 Elm Hill Ct
- 107 Elm Hill Ct
- 109 Elm Hill Ct
- 112 Oakridge Dr
- 1426 N L B J Dr