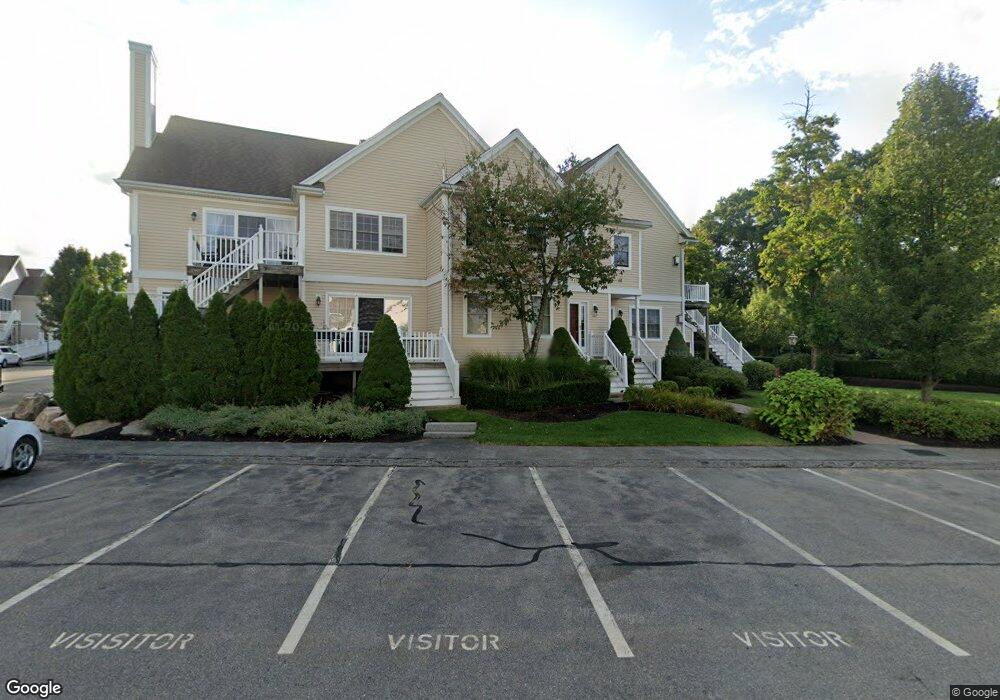
105 Regency Ln Abington, MA 02351
Estimated Value: $403,000 - $471,732
2
Beds
3
Baths
1,400
Sq Ft
$313/Sq Ft
Est. Value
About This Home
This home is located at 105 Regency Ln, Abington, MA 02351 and is currently estimated at $438,183, approximately $312 per square foot. 105 Regency Ln is a home located in Plymouth County with nearby schools including Woodsdale School, Beaver Brook Elementary School, and Abington Middle School.
Ownership History
Date
Name
Owned For
Owner Type
Purchase Details
Closed on
Dec 30, 2024
Sold by
Holt Trevor
Bought by
Vivona Anthony
Current Estimated Value
Home Financials for this Owner
Home Financials are based on the most recent Mortgage that was taken out on this home.
Original Mortgage
$357,000
Outstanding Balance
$353,865
Interest Rate
6.78%
Mortgage Type
Purchase Money Mortgage
Estimated Equity
$84,318
Purchase Details
Closed on
Nov 19, 2018
Sold by
Limpanatharn Wanida
Bought by
Holt Trevor
Home Financials for this Owner
Home Financials are based on the most recent Mortgage that was taken out on this home.
Original Mortgage
$340,159
Interest Rate
4.7%
Mortgage Type
FHA
Purchase Details
Closed on
Aug 24, 2015
Sold by
Vaz Stephanie A and Maxwell Dana R
Bought by
Limpanathorn Wanida
Purchase Details
Closed on
May 5, 2003
Sold by
Gables Dev Corp
Bought by
Vaz Stephanie A
Home Financials for this Owner
Home Financials are based on the most recent Mortgage that was taken out on this home.
Original Mortgage
$240,943
Interest Rate
5.82%
Mortgage Type
Purchase Money Mortgage
Create a Home Valuation Report for This Property
The Home Valuation Report is an in-depth analysis detailing your home's value as well as a comparison with similar homes in the area
Home Values in the Area
Average Home Value in this Area
Purchase History
| Date | Buyer | Sale Price | Title Company |
|---|---|---|---|
| Vivona Anthony | $420,000 | None Available | |
| Vivona Anthony | $420,000 | None Available | |
| Holt Trevor | $350,000 | -- | |
| Limpanathorn Wanida | $305,000 | -- | |
| Vaz Stephanie A | $253,625 | -- | |
| Vaz Stephanie A | $253,625 | -- |
Source: Public Records
Mortgage History
| Date | Status | Borrower | Loan Amount |
|---|---|---|---|
| Open | Vivona Anthony | $357,000 | |
| Closed | Vivona Anthony | $357,000 | |
| Previous Owner | Holt Trevor | $340,159 | |
| Previous Owner | Vaz Stephanie A | $98,350 | |
| Previous Owner | Vaz Stephanie A | $240,943 |
Source: Public Records
Tax History Compared to Growth
Tax History
| Year | Tax Paid | Tax Assessment Tax Assessment Total Assessment is a certain percentage of the fair market value that is determined by local assessors to be the total taxable value of land and additions on the property. | Land | Improvement |
|---|---|---|---|---|
| 2025 | $5,793 | $443,600 | $0 | $443,600 |
| 2024 | $5,523 | $412,800 | $0 | $412,800 |
| 2023 | $5,249 | $369,400 | $0 | $369,400 |
| 2022 | $5,112 | $335,900 | $0 | $335,900 |
| 2021 | $5,045 | $306,100 | $0 | $306,100 |
| 2020 | $5,081 | $298,900 | $0 | $298,900 |
| 2019 | $5,029 | $289,200 | $0 | $289,200 |
| 2018 | $5,271 | $295,800 | $0 | $295,800 |
| 2017 | $5,068 | $276,200 | $0 | $276,200 |
| 2016 | $4,762 | $265,600 | $0 | $265,600 |
| 2015 | $3,883 | $228,400 | $0 | $228,400 |
Source: Public Records
Map
Nearby Homes
- 117 Regency Ln
- 115 Regency Ln
- 113 Regency Ln
- 109 Regency Ln
- 107 Regency Ln
- 103 Regency Ln
- 123 Regency Ln
- 121 Regency Ln
- 119 Regency Ln
- 105 Regency Ln Unit 105,100
- 121 Regency Ln Unit 121
- 103 Regency Ln Unit 103
- 323 Regency Ln
- 321 Regency Ln
- 317 Regency Ln
- 315 Regency Ln
- 313 Regency Ln
- 319 Regency Ln
- 311 Regency Ln
- 309 Regency Ln