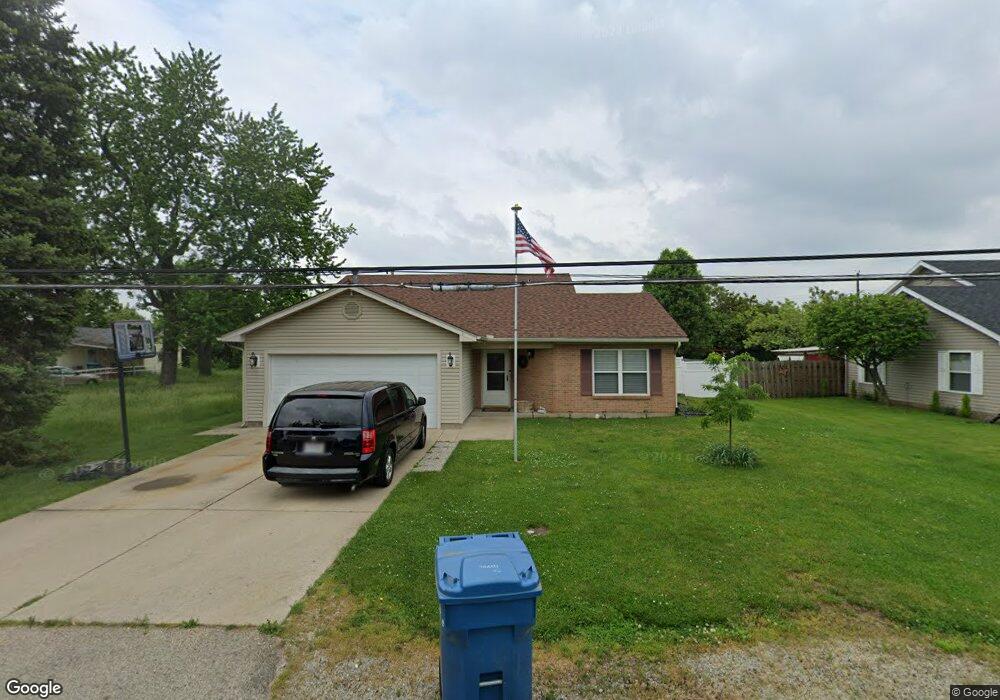
105 S Pleasant Valley Ave Dayton, OH 45404
Avondale NeighborhoodEstimated Value: $162,000 - $226,000
3
Beds
2
Baths
1,584
Sq Ft
$124/Sq Ft
Est. Value
About This Home
This home is located at 105 S Pleasant Valley Ave, Dayton, OH 45404 and is currently estimated at $196,870, approximately $124 per square foot. 105 S Pleasant Valley Ave is a home located in Montgomery County with nearby schools including Stebbins High School, Pathway School of Discovery, and Liberty High School.
Ownership History
Date
Name
Owned For
Owner Type
Purchase Details
Closed on
Oct 5, 2007
Sold by
The Bank Of New York
Bought by
Branscomb Tony A and Branscomb Peggy
Current Estimated Value
Home Financials for this Owner
Home Financials are based on the most recent Mortgage that was taken out on this home.
Original Mortgage
$84,000
Outstanding Balance
$52,906
Interest Rate
6.38%
Mortgage Type
Purchase Money Mortgage
Estimated Equity
$143,964
Purchase Details
Closed on
May 23, 2007
Sold by
Ferguson Loretta and Ferguson Loretta A
Bought by
Jpmorgan Chase Bank and Registered Certificateholders Of Gsamp T
Purchase Details
Closed on
Apr 5, 2002
Sold by
Ferguson Clayton
Bought by
Ferguson Loretta
Purchase Details
Closed on
Oct 23, 1998
Sold by
Livesay Wesley and Livesay Linda F
Bought by
Ferguson Clayton and Ferguson Loretta
Create a Home Valuation Report for This Property
The Home Valuation Report is an in-depth analysis detailing your home's value as well as a comparison with similar homes in the area
Home Values in the Area
Average Home Value in this Area
Purchase History
| Date | Buyer | Sale Price | Title Company |
|---|---|---|---|
| Branscomb Tony A | $84,000 | Titlequest Agency Inc | |
| Jpmorgan Chase Bank | $86,000 | None Available | |
| Ferguson Loretta | -- | -- | |
| Ferguson Clayton | $91,000 | -- | |
| Ferguson Clayton | $91,000 | -- |
Source: Public Records
Mortgage History
| Date | Status | Borrower | Loan Amount |
|---|---|---|---|
| Open | Branscomb Tony A | $84,000 |
Source: Public Records
Tax History Compared to Growth
Tax History
| Year | Tax Paid | Tax Assessment Tax Assessment Total Assessment is a certain percentage of the fair market value that is determined by local assessors to be the total taxable value of land and additions on the property. | Land | Improvement |
|---|---|---|---|---|
| 2024 | $2,320 | $48,880 | $4,130 | $44,750 |
| 2023 | $2,320 | $48,880 | $4,130 | $44,750 |
| 2022 | $2,478 | $39,100 | $3,300 | $35,800 |
| 2021 | $2,526 | $39,100 | $3,300 | $35,800 |
| 2020 | $2,525 | $39,100 | $3,300 | $35,800 |
| 2019 | $2,752 | $38,040 | $2,970 | $35,070 |
| 2018 | $2,758 | $38,040 | $2,970 | $35,070 |
| 2017 | $2,757 | $38,040 | $2,970 | $35,070 |
| 2016 | $2,720 | $36,420 | $3,300 | $33,120 |
| 2015 | $2,834 | $36,420 | $3,300 | $33,120 |
| 2014 | $2,834 | $36,420 | $3,300 | $33,120 |
| 2012 | -- | $32,320 | $3,260 | $29,060 |
Source: Public Records
Map
Nearby Homes
- -- Valley Pike
- - Valley Pike
- 2249 - Valley Pike
- 2301 Valley Pike
- 2460 Bushnell Ave
- 546 Wynora Ave
- 2249 Valley Pike
- 2249 Prince Albert Blvd
- 2245 Valley Pike
- 518 Tyron Ave
- - Prince Albert Blvd
- -- Prince Albert Blvd
- - Rondowa Ave
- -- Rondowa Ave
- 29 Barcelona Ave
- 641 Prince Albert Blvd
- 3586 Lane Garden Ct
- 3322 Vagabond Ln
- 1930 Brandt Pike
- 3344 Vagabond Ln
- 101 S Pleasant Valley Ave
- 107 S Pleasant Valley Ave
- 2540 Warrendale Ave
- 113 S Pleasant Valley Ave
- 19 S Pleasant Valley Ave
- 2536 Warrendale Ave
- 125 S Pleasant Valley Ave
- 124 S Pleasant Valley Ave
- 17 S Pleasant Valley Ave
- 2549 Warrendale Ave
- 2532 Warrendale Ave
- 2547 Warrendale Ave
- 2545 Warrendale Ave
- 2528 Warrendale Ave
- 127 S Pleasant Valley Ave
- 2537 Warrendale Ave
- 13 S Pleasant Valley Ave
- 129 Rohrer Blvd
- 11 S Pleasant Valley Ave
- 2524 Warrendale Ave