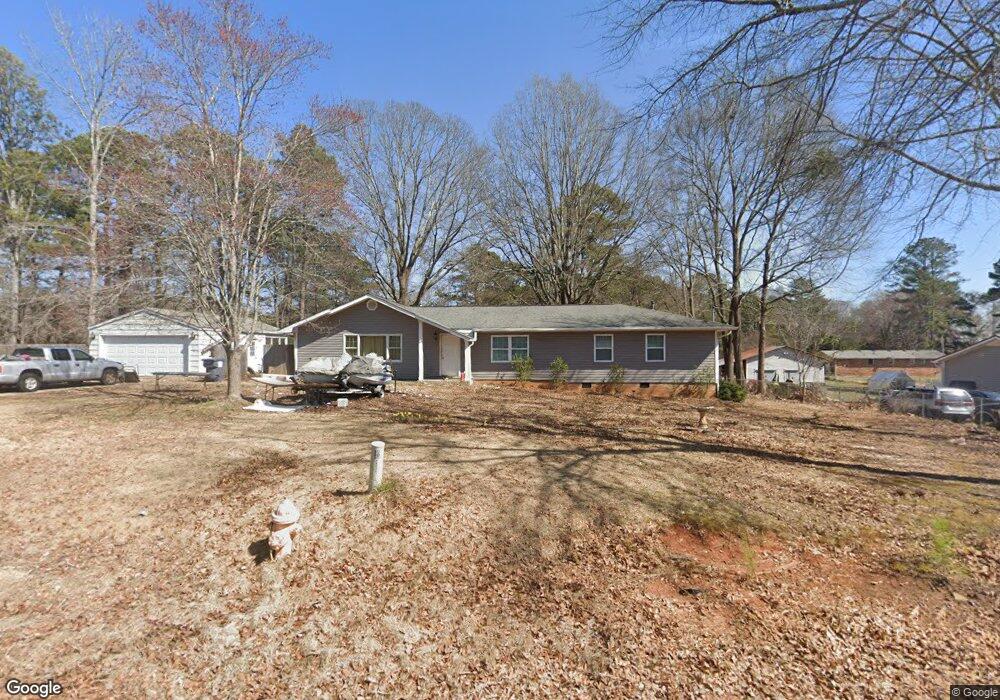
105 Sunny Ln Villa Rica, GA 30180
Estimated Value: $256,000 - $294,000
4
Beds
2
Baths
1,596
Sq Ft
$174/Sq Ft
Est. Value
About This Home
This home is located at 105 Sunny Ln, Villa Rica, GA 30180 and is currently estimated at $277,486, approximately $173 per square foot. 105 Sunny Ln is a home located in Carroll County with nearby schools including Glanton-Hindsman Elementary School, Villa Rica Middle School, and Villa Rica High School.
Ownership History
Date
Name
Owned For
Owner Type
Purchase Details
Closed on
Dec 12, 2016
Sold by
Capra Joseph P
Bought by
Hylton John A
Current Estimated Value
Home Financials for this Owner
Home Financials are based on the most recent Mortgage that was taken out on this home.
Original Mortgage
$123,960
Outstanding Balance
$101,934
Interest Rate
4.13%
Estimated Equity
$175,552
Purchase Details
Closed on
Oct 8, 2009
Sold by
Regions Bank
Bought by
Capra Joseph P
Home Financials for this Owner
Home Financials are based on the most recent Mortgage that was taken out on this home.
Original Mortgage
$55,440
Interest Rate
5.03%
Mortgage Type
New Conventional
Purchase Details
Closed on
Mar 23, 2009
Sold by
Speir John C
Bought by
Regions Bank
Purchase Details
Closed on
Dec 6, 2002
Sold by
Skinner Larry Dan
Bought by
Speir John C
Purchase Details
Closed on
Aug 27, 1999
Sold by
Skinner Larry Dan
Bought by
Whitlock James R
Purchase Details
Closed on
Oct 21, 1975
Bought by
Skinner Larry Dan
Create a Home Valuation Report for This Property
The Home Valuation Report is an in-depth analysis detailing your home's value as well as a comparison with similar homes in the area
Home Values in the Area
Average Home Value in this Area
Purchase History
| Date | Buyer | Sale Price | Title Company |
|---|---|---|---|
| Hylton John A | $120,000 | -- | |
| Capra Joseph P | $69,300 | -- | |
| Regions Bank | -- | -- | |
| Regions Bank | -- | -- | |
| Speir John C | $105,000 | -- | |
| Speir John C | -- | -- | |
| Whitlock James R | $88,800 | -- | |
| Skinner Larry Dan | $24,700 | -- |
Source: Public Records
Mortgage History
| Date | Status | Borrower | Loan Amount |
|---|---|---|---|
| Open | Hylton John A | $123,960 | |
| Previous Owner | Regions Bank | $55,440 |
Source: Public Records
Tax History Compared to Growth
Tax History
| Year | Tax Paid | Tax Assessment Tax Assessment Total Assessment is a certain percentage of the fair market value that is determined by local assessors to be the total taxable value of land and additions on the property. | Land | Improvement |
|---|---|---|---|---|
| 2024 | $1,624 | $87,425 | $12,000 | $75,425 |
| 2023 | $1,624 | $81,027 | $12,000 | $69,027 |
| 2022 | $1,428 | $67,376 | $12,000 | $55,376 |
| 2021 | $1,331 | $60,085 | $12,000 | $48,085 |
| 2020 | $1,230 | $54,389 | $12,000 | $42,389 |
| 2019 | $1,177 | $50,964 | $12,000 | $38,964 |
| 2018 | $1,106 | $46,130 | $12,000 | $34,130 |
| 2017 | $1,110 | $46,130 | $12,000 | $34,130 |
| 2016 | $1,216 | $46,130 | $12,000 | $34,130 |
| 2015 | $974 | $34,826 | $7,000 | $27,826 |
| 2014 | $978 | $34,826 | $7,000 | $27,826 |
Source: Public Records
Map
Nearby Homes
- 95 Sunny Ln
- 178 Harlan Lane Rd
- 115 Sunny Ln
- 188 Harlan Lane Rd
- 100 Sunny Ln
- 0 Sunny Ln Unit 8909701
- 0 Sunny Ln Unit 7442552
- 0 Sunny Ln Unit 8872603
- 0 Sunny Ln Unit 7602795
- 0 Sunny Ln Unit 8221437
- 0 Sunny Ln Unit 7220261
- 85 Sunny Ln
- 116 Sunny Ln
- 198 Harlan Lane Rd
- 125 Sunny Ln
- 144 Sunny Ln
- 160 Harlan Lane Rd
- 84 Sunny Ln
- 81 Sunny Ln
- 124 Sunny Ln