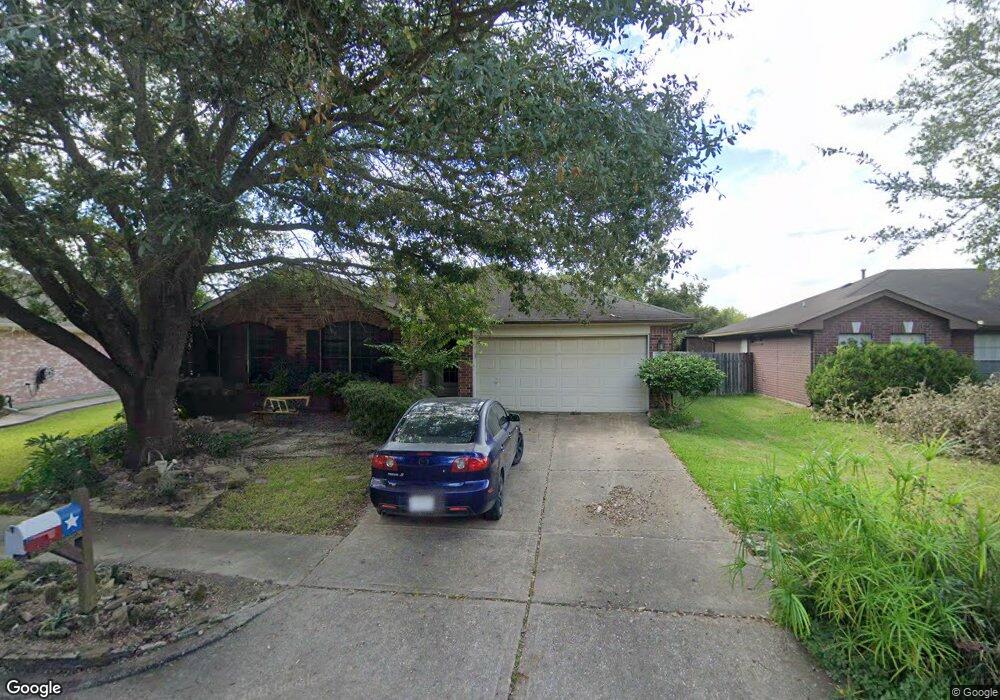
1051 Leadenhall Cir Channelview, TX 77530
Estimated Value: $245,000 - $251,000
4
Beds
2
Baths
1,837
Sq Ft
$135/Sq Ft
Est. Value
About This Home
This home is located at 1051 Leadenhall Cir, Channelview, TX 77530 and is currently estimated at $248,007, approximately $135 per square foot. 1051 Leadenhall Cir is a home located in Harris County with nearby schools including Channelview High School and Family Christian Academy.
Ownership History
Date
Name
Owned For
Owner Type
Purchase Details
Closed on
Jun 29, 2018
Sold by
Hernandez Sergio Lopez
Bought by
Hernandez Sergio Lopez and Loepz Monica
Current Estimated Value
Home Financials for this Owner
Home Financials are based on the most recent Mortgage that was taken out on this home.
Original Mortgage
$96,000
Outstanding Balance
$58,259
Interest Rate
4.6%
Mortgage Type
New Conventional
Estimated Equity
$189,748
Purchase Details
Closed on
Sep 8, 2003
Sold by
Rasmus Marsha and Rasmus Chris B
Bought by
Lopez Sergio and Pineda Maricella
Home Financials for this Owner
Home Financials are based on the most recent Mortgage that was taken out on this home.
Original Mortgage
$115,151
Interest Rate
6.08%
Mortgage Type
FHA
Purchase Details
Closed on
May 30, 1997
Sold by
Mhi Partnership Ltd
Bought by
Rasmus Chris B and Rasmus Marsha
Home Financials for this Owner
Home Financials are based on the most recent Mortgage that was taken out on this home.
Original Mortgage
$64,800
Interest Rate
9%
Create a Home Valuation Report for This Property
The Home Valuation Report is an in-depth analysis detailing your home's value as well as a comparison with similar homes in the area
Home Values in the Area
Average Home Value in this Area
Purchase History
| Date | Buyer | Sale Price | Title Company |
|---|---|---|---|
| Hernandez Sergio Lopez | -- | None Available | |
| Lopez Sergio | -- | Texas American Title Company | |
| Rasmus Chris B | -- | Alamo Title | |
| Rasmus Chris B | -- | Alamo Title |
Source: Public Records
Mortgage History
| Date | Status | Borrower | Loan Amount |
|---|---|---|---|
| Open | Hernandez Sergio Lopez | $96,000 | |
| Closed | Lopez Sergio | $115,151 | |
| Previous Owner | Rasmus Chris B | $64,800 | |
| Closed | Lopez Sergio | $7,500 |
Source: Public Records
Tax History Compared to Growth
Tax History
| Year | Tax Paid | Tax Assessment Tax Assessment Total Assessment is a certain percentage of the fair market value that is determined by local assessors to be the total taxable value of land and additions on the property. | Land | Improvement |
|---|---|---|---|---|
| 2025 | $4,349 | $252,768 | $34,342 | $218,426 |
| 2024 | $4,349 | $244,772 | $34,342 | $210,430 |
| 2023 | $4,349 | $263,309 | $34,342 | $228,967 |
| 2022 | $5,435 | $228,596 | $34,342 | $194,254 |
| 2021 | $5,061 | $201,002 | $34,342 | $166,660 |
| 2020 | $5,066 | $184,111 | $31,137 | $152,974 |
| 2019 | $5,187 | $181,342 | $31,137 | $150,205 |
| 2018 | $1,435 | $133,000 | $32,817 | $100,183 |
| 2017 | $3,396 | $135,061 | $32,817 | $102,244 |
| 2016 | $3,087 | $119,373 | $26,254 | $93,119 |
| 2015 | $2,430 | $104,326 | $16,737 | $87,589 |
| 2014 | $2,430 | $92,434 | $13,127 | $79,307 |
Source: Public Records
Map
Nearby Homes
- 1034 Littleport Ln
- 1123 Maclesby Ln
- 1130 Fairlane Square
- 15122 Sheffield Terrace
- 1315 Goswell Ln
- 909 Pennygent Ln
- 1330 Stevenage Ln
- 1102 Heathfield Dr
- 830 Stonyridge St
- 910 Calm Creek Ct
- 826 Ivy Hollow St
- 814 Deercrest St
- 1343 Littleport Ln
- 15225 Woodforest Blvd
- 827 Dondell St
- 730 Stonyridge St
- 730 Doncrest St
- 727 Doncrest St
- 1323 Padstow Ln
- 15418 Cielo Azul Ln
- 1055 Leadenhall Cir
- 1047 Leadenhall Cir
- 1042 Willersley Ln
- 1034 Willersley Ln
- 1059 Leadenhall Cir
- 1046 Willersley Ln
- 1050 Leadenhall Cir
- 1054 Leadenhall Cir
- 1030 Willersley Ln
- 1039 Leadenhall Cir
- 1058 Leadenhall Cir
- 1012 Willersley Ln
- 15205 Tayport Ln
- 1035 Leadenhall Cir
- 1103 Leadenhall Cir
- 15203 Tayport Ln
- 1010 Willersley Ln
- 1035 Stevenage Ln
- 1043 Willersley Ln
- 1039 Willersley Ln