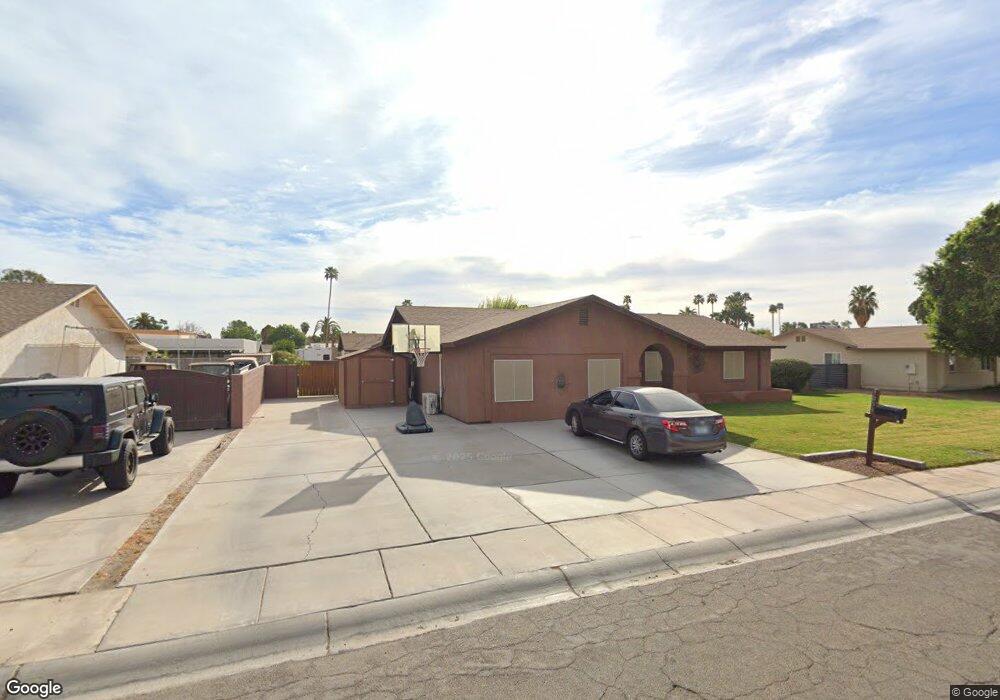
1051 S Mustang Ave Yuma, AZ 85364
Country Estates NeighborhoodEstimated Value: $332,430 - $391,000
4
Beds
2
Baths
1,982
Sq Ft
$186/Sq Ft
Est. Value
About This Home
This home is located at 1051 S Mustang Ave, Yuma, AZ 85364 and is currently estimated at $369,608, approximately $186 per square foot. 1051 S Mustang Ave is a home located in Yuma County with nearby schools including Ronald Reagan Fundamental School, Centennial Middle School, and Cibola High School.
Ownership History
Date
Name
Owned For
Owner Type
Purchase Details
Closed on
Feb 12, 2013
Sold by
Dresselhaus Robert J and Dresselhaus Cindy M
Bought by
Dresselhaus Robert J and Dresselhaus Cindy M
Current Estimated Value
Home Financials for this Owner
Home Financials are based on the most recent Mortgage that was taken out on this home.
Original Mortgage
$89,000
Interest Rate
3.29%
Mortgage Type
New Conventional
Purchase Details
Closed on
Jun 3, 2009
Sold by
Dresselhaus Robert Jay and Dresselhaus Cindy Marie
Bought by
Dresselhaus Robert and Dresselhaus Cindy
Purchase Details
Closed on
Dec 7, 2007
Sold by
Deesselhaus Cindy Marie and Saxby Cindy Marie
Bought by
Dresselhaus Robert Jay and Dresselhaus Cindy Marie
Purchase Details
Closed on
Aug 16, 2001
Sold by
Saxby Bradford Snow
Bought by
Saxby Cindy Marie
Home Financials for this Owner
Home Financials are based on the most recent Mortgage that was taken out on this home.
Original Mortgage
$98,400
Interest Rate
7.09%
Create a Home Valuation Report for This Property
The Home Valuation Report is an in-depth analysis detailing your home's value as well as a comparison with similar homes in the area
Home Values in the Area
Average Home Value in this Area
Purchase History
| Date | Buyer | Sale Price | Title Company |
|---|---|---|---|
| Dresselhaus Robert J | -- | Chicago Title | |
| Dresselhaus Robert J | -- | Chicago Title | |
| Dresselhaus Robert | -- | None Available | |
| Dresselhaus Robert Jay | -- | None Available | |
| Saxby Cindy Marie | -- | First American Title |
Source: Public Records
Mortgage History
| Date | Status | Borrower | Loan Amount |
|---|---|---|---|
| Closed | Dresselhaus Robert J | $89,000 | |
| Closed | Saxby Cindy Marie | $98,400 | |
| Closed | Saxby Cindy Marie | $8,000 |
Source: Public Records
Tax History Compared to Growth
Tax History
| Year | Tax Paid | Tax Assessment Tax Assessment Total Assessment is a certain percentage of the fair market value that is determined by local assessors to be the total taxable value of land and additions on the property. | Land | Improvement |
|---|---|---|---|---|
| 2025 | $1,392 | $13,062 | $3,453 | $9,609 |
| 2024 | $1,325 | $12,441 | $3,357 | $9,084 |
| 2023 | $1,325 | $11,848 | $2,952 | $8,896 |
| 2022 | $1,291 | $11,284 | $3,181 | $8,103 |
| 2021 | $1,360 | $10,747 | $2,633 | $8,114 |
| 2020 | $1,321 | $10,235 | $2,540 | $7,695 |
| 2019 | $1,299 | $9,748 | $2,536 | $7,212 |
| 2018 | $1,201 | $9,284 | $2,919 | $6,365 |
| 2017 | $1,177 | $9,284 | $2,919 | $6,365 |
| 2016 | $1,130 | $8,420 | $2,030 | $6,390 |
| 2015 | $919 | $8,019 | $2,557 | $5,462 |
| 2014 | $919 | $7,637 | $2,500 | $5,137 |
Source: Public Records
Map
Nearby Homes
- 1031 S Brahma Ln
- 2779 W 8th St Unit 17A
- 2779 W 8th St Unit 193
- 2952 W 11th St
- S Avenue B
- 2864 W 12th Ln
- 1159 S Avenue B
- 1183 S 24th Dr
- 1111 S Avenue B Unit 36
- 1111 S Avenue B Unit A
- 2700 W 8th St
- 1079 S Avenue B Unit 24
- 2350 W 12th Ln
- 1272 S 24th Ave
- 2420 W 13th Place
- 3225 W 8th St Unit 119
- 3520 W Crane St
- 1363 S 24th Ave
- 650 S Avenue B
- 833 S Palm Ave
- 1043 S Mustang Ave
- 1059 S Mustang Ave
- 1066 S Brangus Ave
- 1050 S Brangus Ave
- 1082 S Brangus Ave
- 1052 S Mustang Ave
- 1044 S Mustang Ave
- 1060 S Mustang Ave
- 1035 S Mustang Ave
- 1067 S Mustang Ave
- 1034 S Brangus Ave
- 1098 S Brangus Ave
- 1036 S Mustang Ave
- 1068 S Mustang Ave
- 1053 S Appaloosa Ln
- 1065 S Brangus Ave
- 1049 S Brangus Ave Unit IV
- 1081 S Brangus Ave
- 1061 S Appaloosa Ln
- 1101 S Mustang Ave