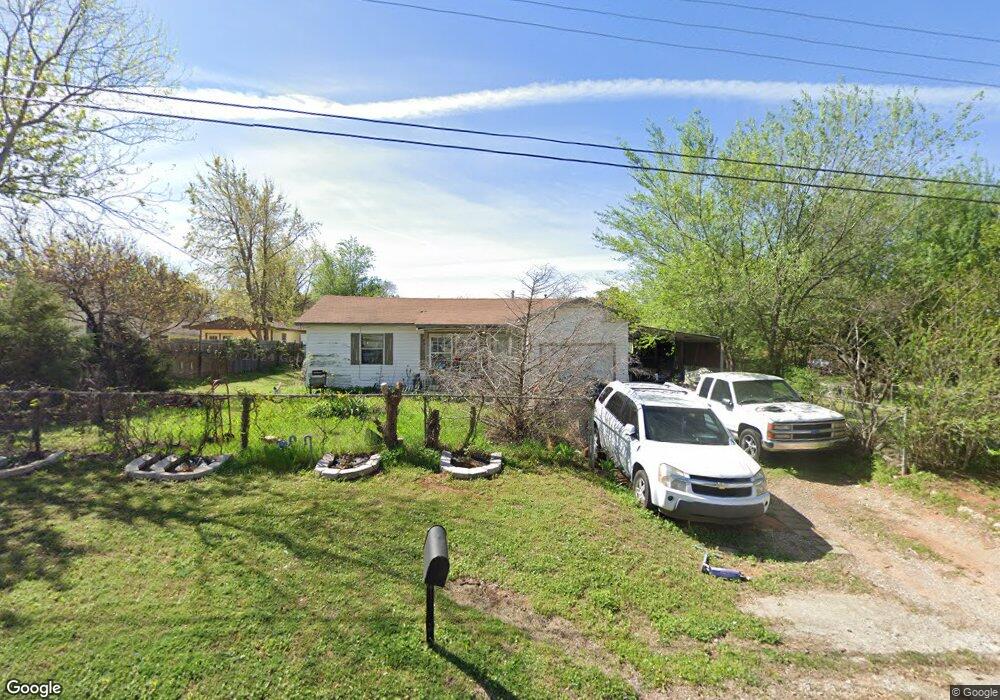
10512 Lejean Dr Oklahoma City, OK 73130
Estimated Value: $72,000 - $122,000
2
Beds
1
Bath
758
Sq Ft
$123/Sq Ft
Est. Value
About This Home
This home is located at 10512 Lejean Dr, Oklahoma City, OK 73130 and is currently estimated at $93,337, approximately $123 per square foot. 10512 Lejean Dr is a home located in Oklahoma County with nearby schools including Nicoma Park Elementary School, Nicoma Park Intermediate Elementary School, and Nicoma Park Middle School.
Ownership History
Date
Name
Owned For
Owner Type
Purchase Details
Closed on
Nov 8, 2010
Sold by
Sudderth Nita and Sudderth Chris
Bought by
Murray Patricia
Current Estimated Value
Home Financials for this Owner
Home Financials are based on the most recent Mortgage that was taken out on this home.
Original Mortgage
$35,000
Outstanding Balance
$23,731
Interest Rate
4.82%
Mortgage Type
Seller Take Back
Estimated Equity
$69,606
Purchase Details
Closed on
Mar 28, 2008
Sold by
Wear Mark K and Wear Naomi B
Bought by
Sudderth Katherine
Home Financials for this Owner
Home Financials are based on the most recent Mortgage that was taken out on this home.
Original Mortgage
$70,939
Outstanding Balance
$45,007
Interest Rate
6%
Mortgage Type
FHA
Estimated Equity
$48,330
Purchase Details
Closed on
Apr 5, 2006
Sold by
Rak Properties Inc
Bought by
Wear Mark K and Wear Naomi B
Purchase Details
Closed on
Mar 9, 2006
Sold by
Staples Farold Dean and Staples Barbara
Bought by
Rak Properties Inc
Create a Home Valuation Report for This Property
The Home Valuation Report is an in-depth analysis detailing your home's value as well as a comparison with similar homes in the area
Home Values in the Area
Average Home Value in this Area
Purchase History
| Date | Buyer | Sale Price | Title Company |
|---|---|---|---|
| Murray Patricia | $35,000 | None Available | |
| Sudderth Katherine | $71,500 | Stewart Escrow & Title Midwe | |
| Wear Mark K | $30,000 | None Available | |
| Rak Properties Inc | $33,000 | None Available |
Source: Public Records
Mortgage History
| Date | Status | Borrower | Loan Amount |
|---|---|---|---|
| Open | Murray Patricia | $35,000 | |
| Open | Sudderth Katherine | $70,939 |
Source: Public Records
Tax History Compared to Growth
Tax History
| Year | Tax Paid | Tax Assessment Tax Assessment Total Assessment is a certain percentage of the fair market value that is determined by local assessors to be the total taxable value of land and additions on the property. | Land | Improvement |
|---|---|---|---|---|
| 2024 | $1,022 | $8,355 | $2,268 | $6,087 |
| 2023 | $1,022 | $7,957 | $2,222 | $5,735 |
| 2022 | $964 | $7,578 | $2,273 | $5,305 |
| 2021 | $914 | $7,218 | $3,200 | $4,018 |
| 2020 | $878 | $6,875 | $1,782 | $5,093 |
| 2019 | $931 | $7,370 | $1,544 | $5,826 |
| 2018 | $882 | $7,370 | $0 | $0 |
| 2017 | $879 | $7,350 | $1,540 | $5,810 |
| 2016 | $844 | $6,999 | $1,523 | $5,476 |
| 2015 | $833 | $6,667 | $1,870 | $4,797 |
| 2014 | $805 | $6,414 | $1,870 | $4,544 |
Source: Public Records
Map
Nearby Homes
- 10505 Willow Ridge Dr
- 10813 SE 9th St
- 10800 SE 9th St
- 1104 Victor Ct
- 10305 Saint Patrick Dr
- 000 Tbd Bellview Dr
- 10236 Bellmont Ave
- 10820 Ohara Ln
- 313 Remington Ave
- 1301 Grand Manor
- 11101 E Reno Ave
- 10107 Saint Patrick Dr
- 1501 S Avery Ave
- 9909 Fox Fair Hollow
- 104 Stone Creek Rd
- 0 SE 15th St
- 11030 Madison Ave
- 10323 Haven Cir
- 1917 Goldenrod Ln
- 129 Oak Tree Dr
- 10516 Lejean Dr
- 10508 Lejean Dr
- 10517 Bellview Dr
- 10525 Bellview Dr
- 10509 Bellview Dr
- 10509 Lejean Dr
- 10600 Lejean Dr
- 10500 Lejean Dr
- 10505 Lejean Dr
- 10513 Lejean Dr
- 10601 Bellview Dr
- 10501 Bellview Dr
- 10501 Lejean Dr
- 10601 Lejean Dr
- 10608 Lejean Dr
- 10609 Bellview Dr
- 10518 Bellview Dr
- 10524 Bellview Dr
- 10512 Bellview Dr
- 10506 Bellview Dr