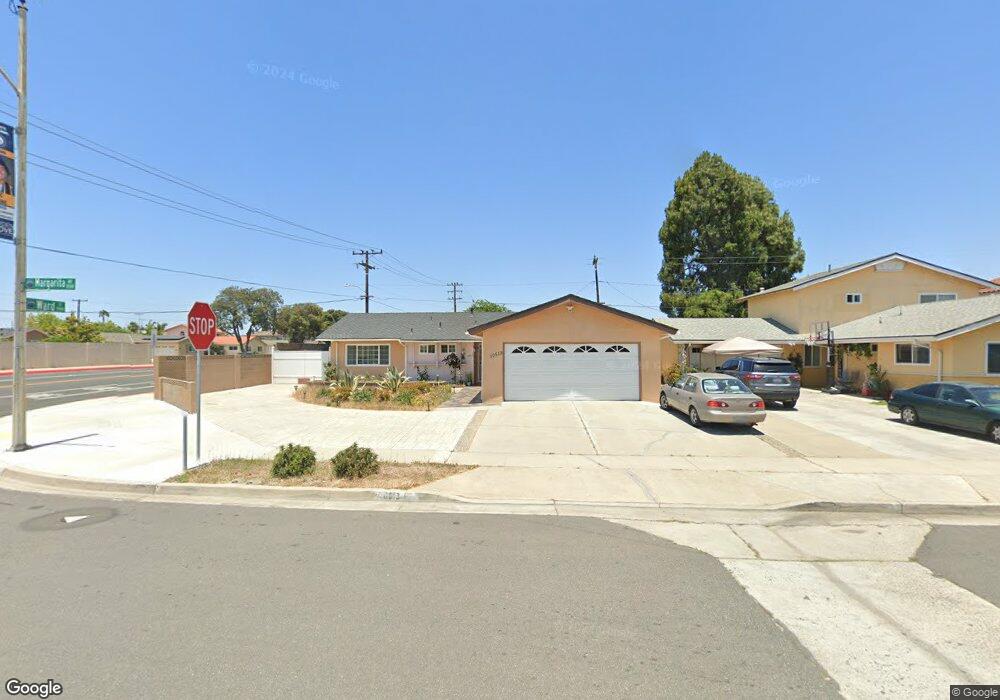
10513 Margarita Ave Fountain Valley, CA 92708
Star View NeighborhoodEstimated Value: $1,142,686 - $1,233,000
4
Beds
3
Baths
1,428
Sq Ft
$825/Sq Ft
Est. Value
About This Home
This home is located at 10513 Margarita Ave, Fountain Valley, CA 92708 and is currently estimated at $1,177,672, approximately $824 per square foot. 10513 Margarita Ave is a home located in Orange County with nearby schools including Thomas Paine Elementary School, McGarvin Intermediate School, and La Quinta High School.
Ownership History
Date
Name
Owned For
Owner Type
Purchase Details
Closed on
Jul 31, 2009
Sold by
Kasalian Sarkis and Kasalian Milina Maral
Bought by
Kasalian Sarkis and Kasalian Milina Maral
Current Estimated Value
Purchase Details
Closed on
May 29, 2001
Sold by
Kasalian Milina Maral
Bought by
Kasalian Sarkis and Kasalian Milina Maral
Purchase Details
Closed on
Apr 6, 2001
Sold by
Kasalian Sarkis
Bought by
Kasalian Milina Maral
Purchase Details
Closed on
Feb 14, 2001
Sold by
Ramirez Lorenzo Zambrano and Ramirez Consuelo
Bought by
Kasalian Milina Maral
Purchase Details
Closed on
Nov 2, 1993
Sold by
Carey Patsy
Bought by
Ramirez Lorenzo Zambrano and Ramirez Consuelo
Home Financials for this Owner
Home Financials are based on the most recent Mortgage that was taken out on this home.
Original Mortgage
$177,500
Interest Rate
7.09%
Create a Home Valuation Report for This Property
The Home Valuation Report is an in-depth analysis detailing your home's value as well as a comparison with similar homes in the area
Home Values in the Area
Average Home Value in this Area
Purchase History
| Date | Buyer | Sale Price | Title Company |
|---|---|---|---|
| Kasalian Sarkis | -- | None Available | |
| Kasalian Sarkis | -- | -- | |
| Kasalian Milina Maral | -- | American Title Co | |
| Kasalian Milina Maral | $259,000 | American Title Co | |
| Ramirez Lorenzo Zambrano | $187,000 | Gateway Title Company |
Source: Public Records
Mortgage History
| Date | Status | Borrower | Loan Amount |
|---|---|---|---|
| Previous Owner | Ramirez Lorenzo Zambrano | $177,500 |
Source: Public Records
Tax History Compared to Growth
Tax History
| Year | Tax Paid | Tax Assessment Tax Assessment Total Assessment is a certain percentage of the fair market value that is determined by local assessors to be the total taxable value of land and additions on the property. | Land | Improvement |
|---|---|---|---|---|
| 2025 | $4,511 | $390,259 | $292,062 | $98,197 |
| 2024 | $4,511 | $382,607 | $286,335 | $96,272 |
| 2023 | $4,425 | $375,105 | $280,720 | $94,385 |
| 2022 | $4,328 | $367,750 | $275,215 | $92,535 |
| 2021 | $4,283 | $360,540 | $269,819 | $90,721 |
| 2020 | $4,224 | $356,844 | $267,053 | $89,791 |
| 2019 | $4,143 | $349,848 | $261,817 | $88,031 |
| 2018 | $4,059 | $342,989 | $256,684 | $86,305 |
| 2017 | $4,003 | $336,264 | $251,651 | $84,613 |
| 2016 | $3,829 | $329,671 | $246,717 | $82,954 |
| 2015 | $3,775 | $324,720 | $243,012 | $81,708 |
| 2014 | $3,681 | $318,360 | $238,252 | $80,108 |
Source: Public Records
Map
Nearby Homes
- 10744 Lehnhardt Ave
- 15890 Camo Bluff Ct
- 10562 Davit Ave
- 15781 Clarendon St
- 9801 Hibiscus Ave
- 16379 Shadbush St
- 10632 Henderson Ave
- 507 S Euclid St Unit 71
- 901 S Harmon St
- 10200 Bolsa Ave Unit 23
- 5112 W 1st St Unit C
- 5114 W 1st St Unit C
- 4512 W Watkins Way
- 15710 Poinsettia Way
- 11356 Stonecress Ave
- 9485 Geranium Cir
- 5405 W 4th St
- 9936 Pear Dr
- 323 N Euclid St Unit 99
- 17071 Ward St
- 0 Ward St
- 10525 Margarita Ave
- 10537 Margarita Ave
- 10485 Margarita Ave
- 10549 Margarita Ave
- 10516 Margarita Ave
- 10526 Margarita Ave
- 10473 Margarita Ave
- 10538 Margarita Ave
- 10559 Margarita Ave
- 15871 Ward St
- 10550 Margarita Ave
- 15861 Ward St
- 15915 Ward St
- 10461 Margarita Ave
- 15851 Ward St
- 10513 Morning Glory Cir
- 10560 Margarita Ave
- 10571 Margarita Ave
- 15927 Ward St