Estimated Value: $745,000 - $829,000
3
Beds
2
Baths
1,572
Sq Ft
$498/Sq Ft
Est. Value
About This Home
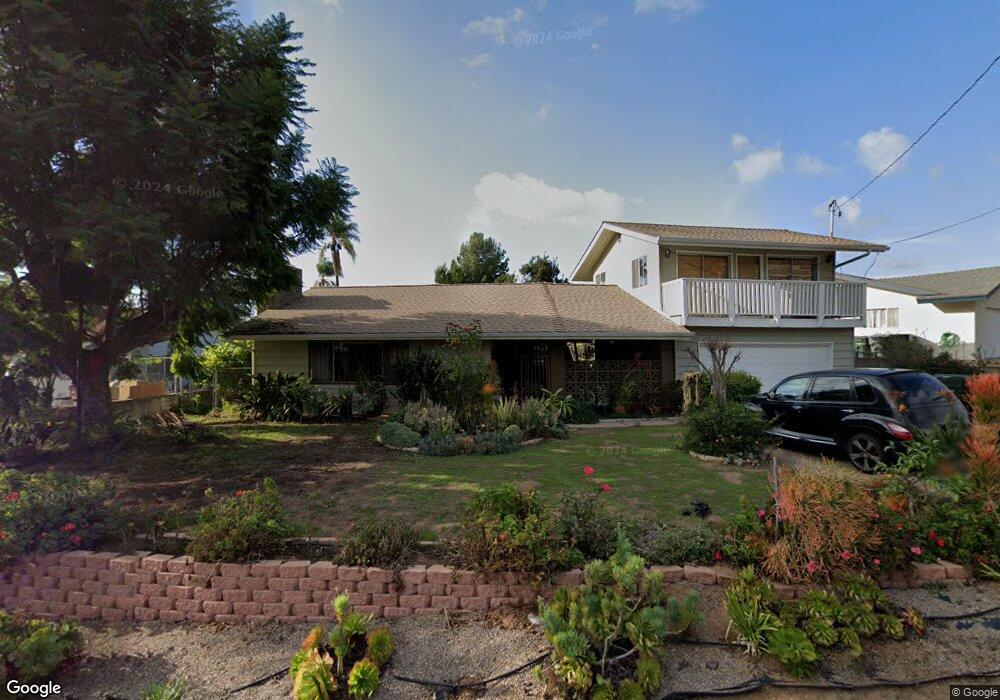
This home is located at 1052 Glenmere Rd, Vista, CA 92084 and is currently estimated at $783,244, approximately $498 per square foot. 1052 Glenmere Rd is a home located in San Diego County with nearby schools including Monte Vista Elementary School, Rancho Minerva Middle School, and Vista High School.
Ownership History
Date
Name
Owned For
Owner Type
Purchase Details
Closed on
May 25, 2001
Sold by
Booth David R
Bought by
Booth David R and Booth Julita M
Current Estimated Value
Home Financials for this Owner
Home Financials are based on the most recent Mortgage that was taken out on this home.
Original Mortgage
$147,250
Outstanding Balance
$55,471
Interest Rate
7.15%
Estimated Equity
$727,773
Purchase Details
Closed on
May 18, 2001
Sold by
Booth Julita M
Bought by
Booth David R
Home Financials for this Owner
Home Financials are based on the most recent Mortgage that was taken out on this home.
Original Mortgage
$147,250
Outstanding Balance
$55,471
Interest Rate
7.15%
Estimated Equity
$727,773
Purchase Details
Closed on
Jul 31, 1996
Sold by
Mcneal Trust and Robert J
Bought by
Booth David R
Home Financials for this Owner
Home Financials are based on the most recent Mortgage that was taken out on this home.
Original Mortgage
$124,110
Interest Rate
8.33%
Mortgage Type
VA
Create a Home Valuation Report for This Property
The Home Valuation Report is an in-depth analysis detailing your home's value as well as a comparison with similar homes in the area
Home Values in the Area
Average Home Value in this Area
Purchase History
| Date | Buyer | Sale Price | Title Company |
|---|---|---|---|
| Booth David R | -- | Chicago Title Co | |
| Booth David R | -- | Chicago Title Co | |
| Booth David R | $138,000 | Fidelity National Title |
Source: Public Records
Mortgage History
| Date | Status | Borrower | Loan Amount |
|---|---|---|---|
| Open | Booth David R | $147,250 | |
| Closed | Booth David R | $124,110 |
Source: Public Records
Tax History Compared to Growth
Tax History
| Year | Tax Paid | Tax Assessment Tax Assessment Total Assessment is a certain percentage of the fair market value that is determined by local assessors to be the total taxable value of land and additions on the property. | Land | Improvement |
|---|---|---|---|---|
| 2025 | $3,083 | $224,563 | $51,146 | $173,417 |
| 2024 | $3,083 | $220,161 | $50,144 | $170,017 |
| 2023 | $3,025 | $215,845 | $49,161 | $166,684 |
| 2022 | $3,017 | $211,614 | $48,198 | $163,416 |
| 2021 | $2,951 | $207,465 | $47,253 | $160,212 |
| 2020 | $2,929 | $205,339 | $46,769 | $158,570 |
| 2019 | $2,889 | $201,313 | $45,852 | $155,461 |
| 2018 | $2,779 | $197,366 | $44,953 | $152,413 |
| 2017 | $122 | $193,497 | $44,072 | $149,425 |
| 2016 | $2,675 | $189,704 | $43,208 | $146,496 |
| 2015 | $2,657 | $186,855 | $42,559 | $144,296 |
| 2014 | $2,595 | $183,196 | $41,726 | $141,470 |
Source: Public Records
Map
Nearby Homes
- 1012 Rosario Ln
- 1045 E Vista Way Unit 18
- 1045-51 Meadow Lake Dr
- 1037-43 Meadow Lake Dr
- 1015 Anza Ave
- 1119 Delpy View Ln
- 1132 Delpy View Point
- 1138 Delpy View Point
- 820 Frances Dr
- 0 Vale Terrace Dr
- 1010 E Bobier Dr Unit 12
- 1010 E Bobier Dr Unit 44
- 1010 E Bobier Dr Unit Space 51
- 1010 E Bobier Dr Unit 112
- 1010 E Bobier Dr Unit 59
- 1010 E Bobier Dr Unit 137
- 1010 E Bobier Dr Unit 89
- 1010 E Bobier Dr Unit 22
- 1010 E Bobier Dr Unit 204
- 737 Nob Cir
- 1044 Glenmere Rd
- 1060 Glenmere Rd
- 1031 Sapote Ct
- 1025 Sapote Ct
- 1036 Glenmere Rd
- 1043 Oak Dr
- 1053 Glenmere Rd
- 1057 Glenmere Rd
- 1035 Oak Dr
- 1045 Glenmere Rd
- 1015 Sapote Ct Unit 17
- 1028 Sapote Ct
- 1026 Sapote Ct
- 1026-28 Sapote Ct
- 1069 Glenmere Rd
- 1037 Glenmere Rd
- 1022 Sapote Ct
- 1020 Sapote Ct Unit 22
- 1023 Oak Dr Unit D
- 1023 Oak Dr Unit A