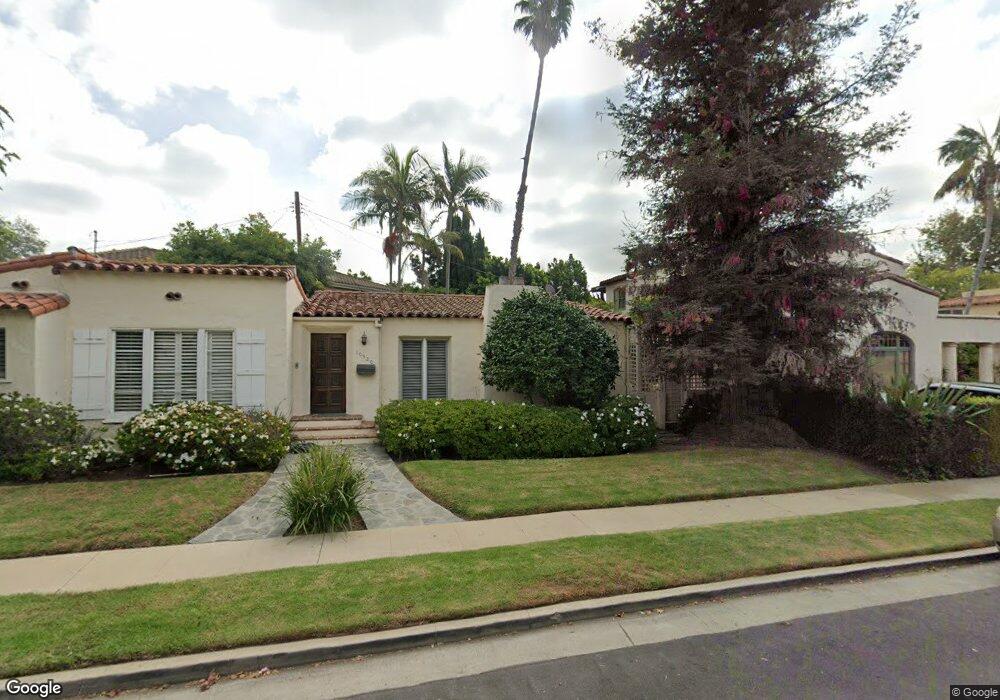
10520 Lauriston Ave Los Angeles, CA 90064
West Los Angeles NeighborhoodEstimated Value: $2,090,069 - $2,336,000
3
Beds
2
Baths
1,879
Sq Ft
$1,162/Sq Ft
Est. Value
About This Home
This home is located at 10520 Lauriston Ave, Los Angeles, CA 90064 and is currently estimated at $2,183,517, approximately $1,162 per square foot. 10520 Lauriston Ave is a home located in Los Angeles County with nearby schools including Daniel Webster Middle School, Westwood Charter School, and Ralph Waldo Emerson Community Charter Middle School.
Ownership History
Date
Name
Owned For
Owner Type
Purchase Details
Closed on
Feb 26, 2015
Sold by
Amster Michael
Bought by
Michael M Amster Revocable Trust
Current Estimated Value
Purchase Details
Closed on
Aug 1, 2000
Sold by
Rosenberg Daryl
Bought by
Amster Michael and Charette Susan
Home Financials for this Owner
Home Financials are based on the most recent Mortgage that was taken out on this home.
Original Mortgage
$540,000
Outstanding Balance
$190,957
Interest Rate
7.87%
Estimated Equity
$1,992,560
Purchase Details
Closed on
Nov 11, 1994
Sold by
Weitz Ted P
Bought by
Rosenberg Daryl and Rosenberg Elizabeth
Home Financials for this Owner
Home Financials are based on the most recent Mortgage that was taken out on this home.
Original Mortgage
$300,000
Interest Rate
9.28%
Create a Home Valuation Report for This Property
The Home Valuation Report is an in-depth analysis detailing your home's value as well as a comparison with similar homes in the area
Home Values in the Area
Average Home Value in this Area
Purchase History
| Date | Buyer | Sale Price | Title Company |
|---|---|---|---|
| Michael M Amster Revocable Trust | -- | None Available | |
| Amster Michael | $675,000 | Equity Title Company | |
| Rosenberg Daryl | $390,000 | Provident Title Company |
Source: Public Records
Mortgage History
| Date | Status | Borrower | Loan Amount |
|---|---|---|---|
| Open | Amster Michael | $540,000 | |
| Previous Owner | Rosenberg Daryl | $300,000 |
Source: Public Records
Tax History Compared to Growth
Tax History
| Year | Tax Paid | Tax Assessment Tax Assessment Total Assessment is a certain percentage of the fair market value that is determined by local assessors to be the total taxable value of land and additions on the property. | Land | Improvement |
|---|---|---|---|---|
| 2025 | $12,237 | $1,017,101 | $787,471 | $229,630 |
| 2024 | $12,237 | $997,159 | $772,031 | $225,128 |
| 2023 | $12,003 | $977,608 | $756,894 | $220,714 |
| 2022 | $11,450 | $958,440 | $742,053 | $216,387 |
| 2021 | $11,304 | $939,648 | $727,503 | $212,145 |
| 2019 | $10,966 | $911,779 | $705,926 | $205,853 |
| 2018 | $10,894 | $893,902 | $692,085 | $201,817 |
| 2016 | $10,415 | $859,192 | $665,211 | $193,981 |
| 2015 | $10,262 | $846,287 | $655,219 | $191,068 |
| 2014 | $10,297 | $829,711 | $642,385 | $187,326 |
Source: Public Records
Map
Nearby Homes
- 2323 S Beverly Glen Blvd Unit 9
- 2240 S Beverly Glen Blvd Unit 103
- 2175 S Beverly Glen Blvd Unit 403
- 10404 Ilona Ave Unit 2
- 10456 Almayo Ave
- 10393 Almayo Ave
- 2372 S Beverly Glen Blvd
- 10349 Keswick Ave
- 2351 Parnell Ave
- 2329 Manning Ave
- 10364 Almayo Ave Unit 205
- 10326 Keswick Ave
- 2203 Pelham Ave
- 10509 Blythe Ave
- 10517 Blythe Ave
- 10336 Almayo Ave Unit 203
- 2030 Pelham Ave
- 1944 S Beverly Glen Blvd
- 1940 S Beverly Glen Blvd
- 10559 Cushdon Ave
- 2217 Patricia Ave
- 10528 Lauriston Ave
- 2209 Patricia Ave
- 2221 Patricia Ave
- 10534 Lauriston Ave
- 2227 Patricia Ave
- 10523 Lauriston Ave
- 10527 Lauriston Ave
- 10519 Lauriston Ave
- 10515 Lauriston Ave
- 10533 Lauriston Ave
- 2231 Patricia Ave
- 10538 Lauriston Ave
- 10511 Lauriston Ave
- 2216 Patricia Ave
- 10539 Lauriston Ave
- 2212 Patricia Ave
- 2222 Patricia Ave
- 10505 Lauriston Ave
- 2235 Patricia Ave Unit ADU-Studio