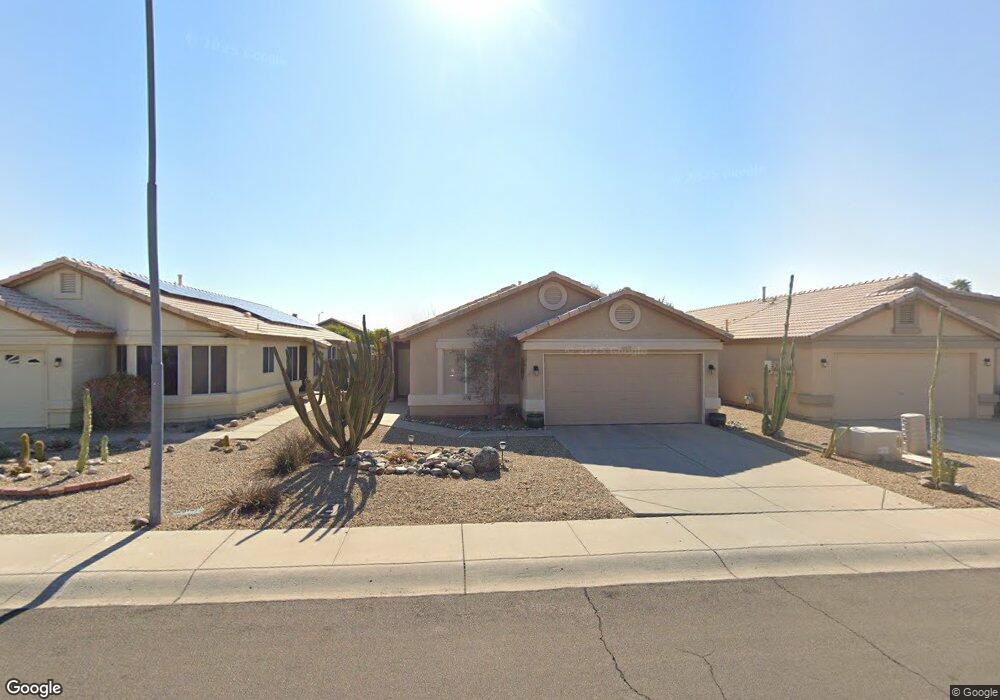
10527 W Mohawk Ln Peoria, AZ 85382
Estimated Value: $297,245 - $362,000
3
Beds
2
Baths
1,295
Sq Ft
$263/Sq Ft
Est. Value
About This Home
This home is located at 10527 W Mohawk Ln, Peoria, AZ 85382 and is currently estimated at $340,561, approximately $262 per square foot. 10527 W Mohawk Ln is a home located in Maricopa County with nearby schools including Parkridge Elementary School, Sunrise Mountain High School, and Candeo Peoria.
Ownership History
Date
Name
Owned For
Owner Type
Purchase Details
Closed on
Jan 27, 2010
Sold by
Campbell Steven R
Bought by
Hubert Melony A
Current Estimated Value
Home Financials for this Owner
Home Financials are based on the most recent Mortgage that was taken out on this home.
Original Mortgage
$132,554
Outstanding Balance
$88,645
Interest Rate
5.24%
Mortgage Type
FHA
Estimated Equity
$251,916
Purchase Details
Closed on
Dec 19, 1996
Sold by
Campbell Stewart R and Campbell June E
Bought by
Campbell Stewart R and Campbell June E
Purchase Details
Closed on
May 15, 1996
Sold by
Warner Mary B
Bought by
Campbell Stewart R and Campbell June E
Home Financials for this Owner
Home Financials are based on the most recent Mortgage that was taken out on this home.
Original Mortgage
$85,500
Interest Rate
8.09%
Mortgage Type
New Conventional
Purchase Details
Closed on
Jun 21, 1994
Sold by
Warner Haldean A and Warner Mary B
Bought by
Warner Mary B
Create a Home Valuation Report for This Property
The Home Valuation Report is an in-depth analysis detailing your home's value as well as a comparison with similar homes in the area
Home Values in the Area
Average Home Value in this Area
Purchase History
| Date | Buyer | Sale Price | Title Company |
|---|---|---|---|
| Hubert Melony A | $135,000 | First American Title Ins Co | |
| Campbell Stewart R | -- | -- | |
| Campbell Stewart R | $95,000 | United Title Agency | |
| Warner Mary B | -- | -- |
Source: Public Records
Mortgage History
| Date | Status | Borrower | Loan Amount |
|---|---|---|---|
| Open | Hubert Melony A | $132,554 | |
| Previous Owner | Campbell Stewart R | $85,500 |
Source: Public Records
Tax History Compared to Growth
Tax History
| Year | Tax Paid | Tax Assessment Tax Assessment Total Assessment is a certain percentage of the fair market value that is determined by local assessors to be the total taxable value of land and additions on the property. | Land | Improvement |
|---|---|---|---|---|
| 2025 | $1,222 | $15,239 | -- | -- |
| 2024 | $1,199 | $14,514 | -- | -- |
| 2023 | $1,199 | $23,900 | $4,780 | $19,120 |
| 2022 | $1,174 | $18,700 | $3,740 | $14,960 |
| 2021 | $1,254 | $17,650 | $3,530 | $14,120 |
| 2020 | $1,266 | $15,450 | $3,090 | $12,360 |
| 2019 | $1,227 | $14,480 | $2,890 | $11,590 |
| 2018 | $1,174 | $13,580 | $2,710 | $10,870 |
| 2017 | $1,176 | $11,770 | $2,350 | $9,420 |
| 2016 | $1,163 | $11,550 | $2,310 | $9,240 |
| 2015 | $1,086 | $10,860 | $2,170 | $8,690 |
Source: Public Records
Map
Nearby Homes
- 20615 N 105th Ave
- 10630 W Mohawk Ln
- 20670 N 105th Dr
- 20360 N 106th Ln
- 10347 W Mohawk Ln
- 10528 W Potter Dr
- 10659 W Yukon Dr
- 20769 N 106th Ln
- 20274 N 104th Ave
- 10379 W Tonopah Dr
- 10722 W Irma Ln
- 10344 W Burnett Rd
- 10728 W Irma Ln
- 10763 W Runion Dr
- 10672 W Ross Ave
- 10368 W Ross Ave
- 20957 N 107th Dr
- 20017 N 101st Ave
- 19845 N Welk Dr
- 20056 N 107th Ln
- 10531 W Mohawk Ln
- 10523 W Mohawk Ln
- 10519 W Mohawk Ln
- 10601 W Mohawk Ln
- 10532 W Runion Dr
- 10536 W Runion Dr
- 10528 W Runion Dr
- 10515 W Mohawk Ln
- 10540 W Runion Dr
- 10524 W Runion Dr
- 10526 W Mohawk Ln
- 10522 W Mohawk Ln
- 10609 W Mohawk Ln
- 10530 W Mohawk Ln
- 10520 W Runion Dr
- 10518 W Mohawk Ln
- 10511 W Mohawk Ln
- 10600 W Runion Dr
- 10534 W Mohawk Ln
- 10514 W Mohawk Ln