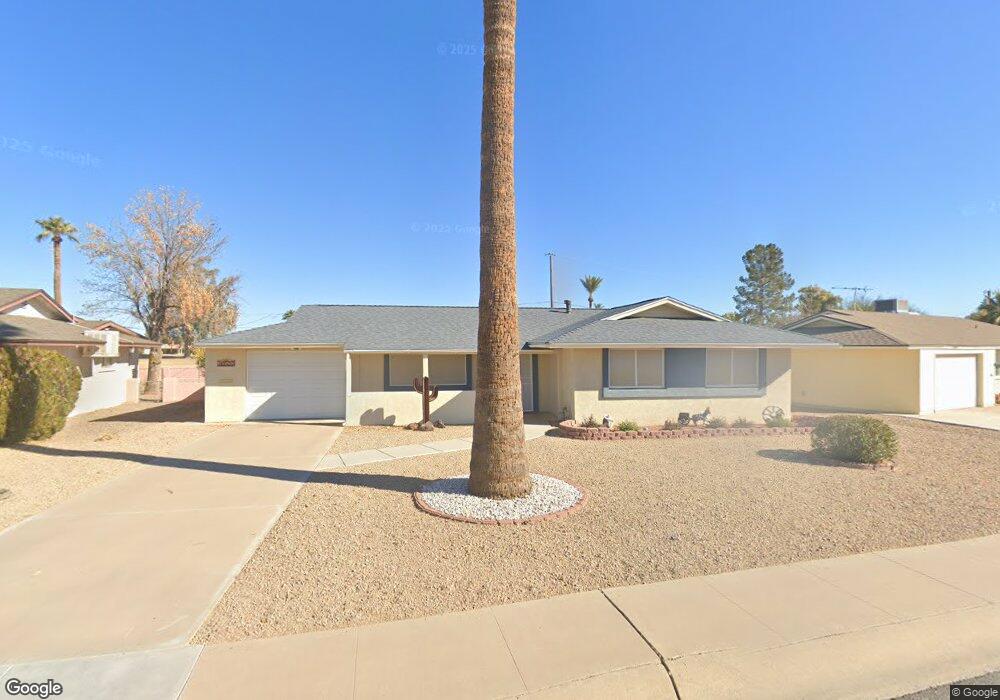
10537 W Connecticut Ave Sun City, AZ 85351
Estimated Value: $238,752 - $281,000
3
Beds
2
Baths
1,165
Sq Ft
$224/Sq Ft
Est. Value
About This Home
This home is located at 10537 W Connecticut Ave, Sun City, AZ 85351 and is currently estimated at $260,938, approximately $223 per square foot. 10537 W Connecticut Ave is a home located in Maricopa County with nearby schools including Desert Mirage Elementary School, Ombudsman - Northwest Charter, and Peoria Accelerated High School.
Ownership History
Date
Name
Owned For
Owner Type
Purchase Details
Closed on
Oct 15, 2019
Sold by
Horn John Michael and Horn Sandra Lou
Bought by
Horn John M and Horn Sandra L
Current Estimated Value
Purchase Details
Closed on
Oct 23, 2008
Sold by
Altemueller Fred
Bought by
Horn John Michael and Horn Sandra Lou
Home Financials for this Owner
Home Financials are based on the most recent Mortgage that was taken out on this home.
Original Mortgage
$100,000
Outstanding Balance
$64,782
Interest Rate
5.9%
Mortgage Type
New Conventional
Estimated Equity
$196,156
Purchase Details
Closed on
Nov 17, 2003
Sold by
Johnson Noel A and Johnson Aaron Paul
Bought by
Altemueller Fred
Purchase Details
Closed on
Mar 20, 2001
Sold by
Rhodes Kevin D
Bought by
Johnson Noel A and Johnson Aaron Paul
Purchase Details
Closed on
Sep 30, 1999
Sold by
Rhodes Marie G
Bought by
Rhodes Marie and Marie Rhodes Trust
Create a Home Valuation Report for This Property
The Home Valuation Report is an in-depth analysis detailing your home's value as well as a comparison with similar homes in the area
Home Values in the Area
Average Home Value in this Area
Purchase History
| Date | Buyer | Sale Price | Title Company |
|---|---|---|---|
| Horn John M | -- | None Available | |
| Horn John Michael | $125,000 | Magnus Title Agency | |
| Altemueller Fred | $126,500 | First American Title Ins Co | |
| Johnson Noel A | $70,000 | First American Title | |
| Rhodes Marie | -- | -- |
Source: Public Records
Mortgage History
| Date | Status | Borrower | Loan Amount |
|---|---|---|---|
| Open | Horn John Michael | $100,000 |
Source: Public Records
Tax History Compared to Growth
Tax History
| Year | Tax Paid | Tax Assessment Tax Assessment Total Assessment is a certain percentage of the fair market value that is determined by local assessors to be the total taxable value of land and additions on the property. | Land | Improvement |
|---|---|---|---|---|
| 2025 | $892 | $9,681 | -- | -- |
| 2024 | $812 | $9,220 | -- | -- |
| 2023 | $812 | $18,960 | $3,790 | $15,170 |
| 2022 | $761 | $13,980 | $2,790 | $11,190 |
| 2021 | $777 | $13,060 | $2,610 | $10,450 |
| 2020 | $758 | $11,570 | $2,310 | $9,260 |
| 2019 | $759 | $10,870 | $2,170 | $8,700 |
| 2018 | $734 | $9,860 | $1,970 | $7,890 |
| 2017 | $712 | $8,660 | $1,730 | $6,930 |
| 2016 | $666 | $7,850 | $1,570 | $6,280 |
| 2015 | $629 | $6,950 | $1,390 | $5,560 |
Source: Public Records
Map
Nearby Homes
- 11622 N Desert Hills Dr W
- 10516 W Snead Dr
- 11427 N 107th Ave
- 10509 W Snead Dr
- 10530 W Desert Hills Ct
- 10414 W Sun City Blvd Unit 1
- 10423 W Monterosa Dr
- 10728 W El Rancho Dr
- 10419 W Snead Dr
- 10702 W Cherry Hills Dr W
- 10810 N Fairway Ct W
- 12035 N Cherry Hills Dr E
- 10279 W Snead Cir N
- 10851 N Fairway Ct W
- 12021 N Riviera Ct
- 10848 W Crosby Dr
- 10829 N Fairway Ct W Unit 106
- 10847 N Fairway Ct E Unit 211
- 10821 N Fairway Ct E
- 10815 W Crosby Dr
- 10543 W Connecticut Ave
- 10531 W Connecticut Ave
- 10549 W Connecticut Ave
- 10525 W Connecticut Ave
- 10538 W Connecticut Ave
- 10532 W Connecticut Ave
- 10544 W Connecticut Ave
- 10526 W Connecticut Ave
- 10553 W Connecticut Ave
- 10519 W Connecticut Ave
- 10550 W Connecticut Ave
- 10512 W Connecticut Ave
- 10559 W Connecticut Ave
- 10552 W Sun City Blvd
- 10546 W Sun City Blvd
- 10540 W Sun City Blvd
- 10604 W Sun City Blvd
- 10515 W Connecticut Ave
- 10558 W Sun City Blvd
- 10532 W Sun City Blvd