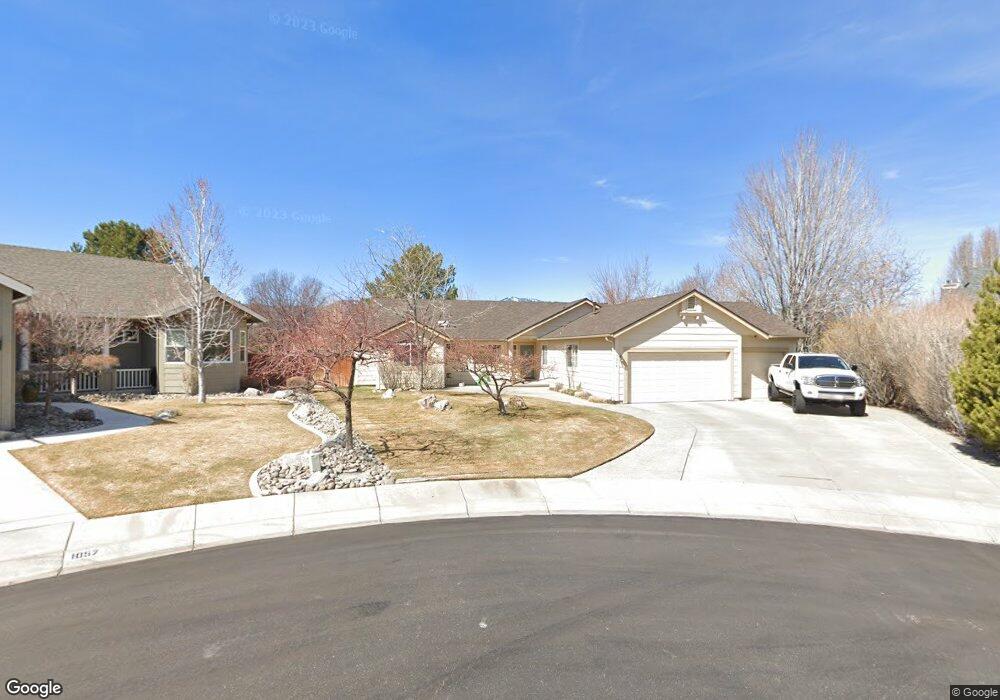
1054 Camellia Ct Unit 6 Minden, NV 89423
Estimated Value: $678,337 - $811,000
4
Beds
3
Baths
2,163
Sq Ft
$343/Sq Ft
Est. Value
About This Home
This home is located at 1054 Camellia Ct Unit 6, Minden, NV 89423 and is currently estimated at $742,334, approximately $343 per square foot. 1054 Camellia Ct Unit 6 is a home located in Douglas County with nearby schools including Minden Elementary School, Carson Valley Middle School, and Douglas County High School.
Ownership History
Date
Name
Owned For
Owner Type
Purchase Details
Closed on
Jul 28, 2015
Sold by
Miller Gantt Wm and Miller Korliss Lee
Bought by
Korliss Llc
Current Estimated Value
Purchase Details
Closed on
Jul 5, 2011
Sold by
Nebe Sherri A
Bought by
Nebe Ty A
Purchase Details
Closed on
Jul 1, 2011
Sold by
Echan Penny and Nebe Ty A
Bought by
Miller Korliss K and Miller Gantt W
Purchase Details
Closed on
Jun 3, 2011
Sold by
Collins Jeffrey M
Bought by
Echan Penny and Nebe Ty A
Purchase Details
Closed on
Mar 9, 2005
Sold by
Collins Jeffrey M
Bought by
Collins Jeffrey M and Collins Catherine C
Home Financials for this Owner
Home Financials are based on the most recent Mortgage that was taken out on this home.
Original Mortgage
$400,000
Interest Rate
5.61%
Mortgage Type
New Conventional
Create a Home Valuation Report for This Property
The Home Valuation Report is an in-depth analysis detailing your home's value as well as a comparison with similar homes in the area
Home Values in the Area
Average Home Value in this Area
Purchase History
| Date | Buyer | Sale Price | Title Company |
|---|---|---|---|
| Korliss Llc | -- | None Available | |
| Miller Gantt Wm | -- | None Available | |
| Nebe Ty A | -- | Stewart Title Carson | |
| Miller Korliss K | $284,000 | Stewart Title Carson | |
| Echan Penny | $222,000 | None Available | |
| Collins Jeffrey M | -- | None Available | |
| Collins Jeffrey M | -- | First American Title |
Source: Public Records
Mortgage History
| Date | Status | Borrower | Loan Amount |
|---|---|---|---|
| Previous Owner | Collins Jeffrey M | $400,000 |
Source: Public Records
Tax History Compared to Growth
Tax History
| Year | Tax Paid | Tax Assessment Tax Assessment Total Assessment is a certain percentage of the fair market value that is determined by local assessors to be the total taxable value of land and additions on the property. | Land | Improvement |
|---|---|---|---|---|
| 2025 | $4,537 | $123,163 | $45,500 | $77,663 |
| 2024 | $4,537 | $123,973 | $45,500 | $78,473 |
| 2023 | $4,379 | $119,636 | $45,500 | $74,136 |
| 2022 | $4,108 | $112,230 | $42,000 | $70,230 |
| 2021 | $3,828 | $105,578 | $38,500 | $67,078 |
| 2020 | $3,702 | $104,916 | $38,500 | $66,416 |
| 2019 | $3,574 | $98,719 | $33,250 | $65,469 |
| 2018 | $3,410 | $93,173 | $29,750 | $63,423 |
| 2017 | $3,369 | $94,030 | $29,750 | $64,280 |
| 2016 | $3,284 | $94,003 | $28,000 | $66,003 |
| 2015 | $3,277 | $94,003 | $28,000 | $66,003 |
| 2014 | $3,176 | $88,639 | $26,250 | $62,389 |
Source: Public Records
Map
Nearby Homes
- 1760 Iris Ct
- 1123 Wisteria Dr
- 1174 Wisteria Dr
- 1749 Bougainvillea Dr
- 1701 Lantana Dr
- 1721 Lantana Dr
- 1775 Linden Ct
- 1769 Evergreen Ct Unit 156
- 1058 Frieda Ln
- 1756 Bella Casa Dr
- 1151 White Oak Loop
- 1719 Bougainvillea Dr
- 1762 La Cita Way
- 1791 La Cita Way
- 1783 Torina Way
- 1707 Monticello Ct
- 1786 Monte Vista Ave
- 1782 Torina Way Unit 43
- 1686 W Minden Village Loop
- 1117 Dapple Dr
- 1052 Camellia Ct
- 1057 Camellia Ct
- 1055 Camellia Ct
- 1104 Wisteria Dr
- 1053 Camellia Ct
- 1112 Wisteria Dr
- 1763 Iris Ct
- 1051 Camellia Ct
- 1116 Wisteria Dr
- 1767 Iris Ct
- 1056 Aster Ct
- 1088 Wisteria Dr
- 1105 Wisteria Dr
- 1771 Iris Ct
- 1058 Aster Ct
- 1099 Wisteria Dr
- 1111 Wisteria Dr
- 1126 Wisteria Dr
- 1115 Wisteria Dr
- 1093 Wisteria Dr