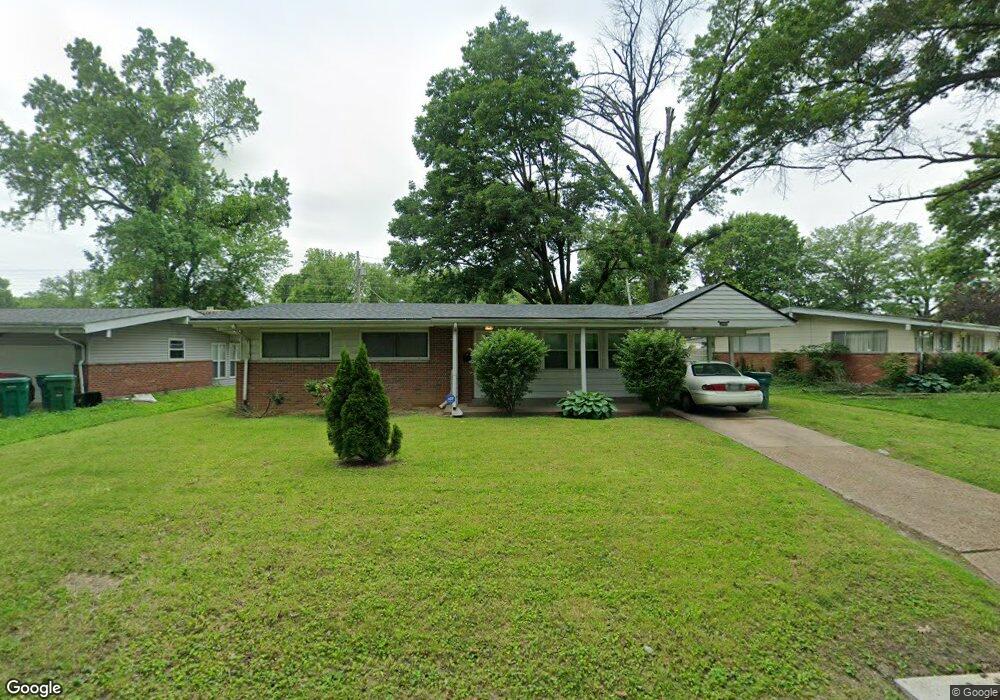
10569 Murat Dr Saint Louis, MO 63136
Hathaway Manor NeighborhoodEstimated Value: $135,118 - $151,000
3
Beds
2
Baths
1,189
Sq Ft
$119/Sq Ft
Est. Value
About This Home
This home is located at 10569 Murat Dr, Saint Louis, MO 63136 and is currently estimated at $141,280, approximately $118 per square foot. 10569 Murat Dr is a home located in St. Louis County with nearby schools including Keeven Elementary School, Hazelwood East High School, and Dwight McDaniels School of Christian Education.
Ownership History
Date
Name
Owned For
Owner Type
Purchase Details
Closed on
Apr 21, 2025
Sold by
Blackmon Andromeda and Blackmon Dennis
Bought by
D & M Enterprises Llc
Current Estimated Value
Home Financials for this Owner
Home Financials are based on the most recent Mortgage that was taken out on this home.
Original Mortgage
$100,500
Outstanding Balance
$100,054
Interest Rate
6.65%
Mortgage Type
New Conventional
Estimated Equity
$41,226
Purchase Details
Closed on
May 23, 2023
Sold by
Heggs Darryl R and Heggs Kim G
Bought by
Blackmon Andromeda and Blackmon Dennis
Purchase Details
Closed on
Dec 14, 2020
Sold by
Strele Donald J
Bought by
Samalion Lori
Purchase Details
Closed on
Jul 29, 2011
Sold by
Strele Donald J and Samalion Arlene
Bought by
Heggs Darryl R and Heggs Kim G
Home Financials for this Owner
Home Financials are based on the most recent Mortgage that was taken out on this home.
Original Mortgage
$65,000
Interest Rate
4.52%
Mortgage Type
Seller Take Back
Create a Home Valuation Report for This Property
The Home Valuation Report is an in-depth analysis detailing your home's value as well as a comparison with similar homes in the area
Home Values in the Area
Average Home Value in this Area
Purchase History
| Date | Buyer | Sale Price | Title Company |
|---|---|---|---|
| D & M Enterprises Llc | -- | None Listed On Document | |
| Blackmon Andromeda | -- | None Listed On Document | |
| Samalion Lori | -- | None Available | |
| Heggs Darryl R | $65,000 | None Available |
Source: Public Records
Mortgage History
| Date | Status | Borrower | Loan Amount |
|---|---|---|---|
| Open | D & M Enterprises Llc | $100,500 | |
| Previous Owner | Heggs Darryl R | $65,000 |
Source: Public Records
Tax History Compared to Growth
Tax History
| Year | Tax Paid | Tax Assessment Tax Assessment Total Assessment is a certain percentage of the fair market value that is determined by local assessors to be the total taxable value of land and additions on the property. | Land | Improvement |
|---|---|---|---|---|
| 2025 | $2,171 | $25,180 | $4,370 | $20,810 |
| 2024 | $2,171 | $23,770 | $3,860 | $19,910 |
| 2023 | $2,171 | $23,770 | $3,860 | $19,910 |
| 2022 | $1,683 | $16,380 | $3,860 | $12,520 |
| 2021 | $1,594 | $16,380 | $3,860 | $12,520 |
| 2020 | $1,611 | $15,430 | $3,860 | $11,570 |
| 2019 | $1,585 | $15,430 | $3,860 | $11,570 |
| 2018 | $1,247 | $11,170 | $1,750 | $9,420 |
| 2017 | $1,245 | $11,170 | $1,750 | $9,420 |
| 2016 | $1,510 | $13,380 | $2,510 | $10,870 |
| 2015 | $1,476 | $13,380 | $2,510 | $10,870 |
| 2014 | $1,689 | $15,280 | $3,310 | $11,970 |
Source: Public Records
Map
Nearby Homes
- 10562 Murat Dr
- 2209 Kipp Ct
- 2131 Old Manor Rd
- 2250 Gadbury Dr
- 2353 Hallwood Dr
- 2241 Luxmore Dr
- 2 Capitol Hill Dr
- 10421 Canfield Dr
- 2283 Hudson Rd
- 62 Capitol Hill Dr
- 2291 Heritage Dr
- 10288 Dacey Dr
- 10246 Dacey Dr
- 1918 Hudson Rd
- 2559 Burchard Dr
- 10421 Monarch Dr
- 11015 Landseer Dr
- 11008 Saginaw Dr
- 10342 Edgefield Dr
- 10230 Green Valley Dr
- 10577 Murat Dr
- 10563 Murat Dr
- 10585 Murat Dr
- 10566 Halls Ferry Rd
- 10557 Murat Dr
- 10600 Old Halls Ferry Rd
- 10560 Halls Ferry Rd
- 10568 Murat Dr
- 10574 Murat Dr
- 10580 Murat Dr
- 10554 Halls Ferry Rd
- 10606 Old Halls Ferry Rd
- 10584 Murat Dr
- 10556 Murat Dr
- 10588 Murat Dr
- 10548 Halls Ferry Rd
- 10545 Murat Dr
- 10550 Murat Dr
- 10592 Murat Dr
- 10542 Halls Ferry Rd