1057 H Ln Big Bear City, CA 92314
Estimated Value: $509,000 - $759,000
3
Beds
3
Baths
2,468
Sq Ft
$245/Sq Ft
Est. Value
About This Home
This home is located at 1057 H Ln, Big Bear City, CA 92314 and is currently estimated at $604,824, approximately $245 per square foot. 1057 H Ln is a home located in San Bernardino County with nearby schools including Baldwin Lane Elementary School, Big Bear Middle School, and Big Bear High School.
Ownership History
Date
Name
Owned For
Owner Type
Purchase Details
Closed on
Jun 6, 2001
Sold by
Dolan June Ann and Bower Debby Rae
Bought by
Vigus Frank and Vigus Patricia
Current Estimated Value
Home Financials for this Owner
Home Financials are based on the most recent Mortgage that was taken out on this home.
Original Mortgage
$201,880
Interest Rate
7.09%
Mortgage Type
VA
Purchase Details
Closed on
Jan 28, 2000
Sold by
Moe Nancy
Bought by
Dolan June Ann and Bower Debby Rae
Home Financials for this Owner
Home Financials are based on the most recent Mortgage that was taken out on this home.
Original Mortgage
$167,200
Interest Rate
7.87%
Purchase Details
Closed on
Jul 13, 1997
Sold by
Bankers Trust Company Of California Na
Bought by
Moe Nancy and Moe Melanie
Purchase Details
Closed on
Jun 5, 1997
Sold by
Crane Jean W
Bought by
Bankers Trust Company Of California Na
Create a Home Valuation Report for This Property
The Home Valuation Report is an in-depth analysis detailing your home's value as well as a comparison with similar homes in the area
Home Values in the Area
Average Home Value in this Area
Purchase History
| Date | Buyer | Sale Price | Title Company |
|---|---|---|---|
| Vigus Frank | $196,000 | Fidelity National Title Ins | |
| Dolan June Ann | $176,000 | Fidelity National Title Ins | |
| Moe Nancy | $77,500 | North American Title Co | |
| Bankers Trust Company Of California Na | $67,900 | Orange Coast Title |
Source: Public Records
Mortgage History
| Date | Status | Borrower | Loan Amount |
|---|---|---|---|
| Previous Owner | Vigus Frank | $201,880 | |
| Previous Owner | Dolan June Ann | $167,200 |
Source: Public Records
Tax History Compared to Growth
Tax History
| Year | Tax Paid | Tax Assessment Tax Assessment Total Assessment is a certain percentage of the fair market value that is determined by local assessors to be the total taxable value of land and additions on the property. | Land | Improvement |
|---|---|---|---|---|
| 2025 | $4,373 | $289,556 | $72,389 | $217,167 |
| 2024 | $4,373 | $283,879 | $70,970 | $212,909 |
| 2023 | $4,256 | $278,312 | $69,578 | $208,734 |
| 2022 | $4,113 | $272,855 | $68,214 | $204,641 |
| 2021 | $4,030 | $267,504 | $66,876 | $200,628 |
| 2020 | $4,051 | $264,761 | $66,190 | $198,571 |
| 2019 | $3,981 | $259,569 | $64,892 | $194,677 |
| 2018 | $3,838 | $254,480 | $63,620 | $190,860 |
| 2017 | $3,740 | $249,491 | $62,373 | $187,118 |
| 2016 | $3,651 | $244,599 | $61,150 | $183,449 |
| 2015 | $3,600 | $240,924 | $60,231 | $180,693 |
| 2014 | $3,532 | $236,204 | $59,051 | $177,153 |
Source: Public Records
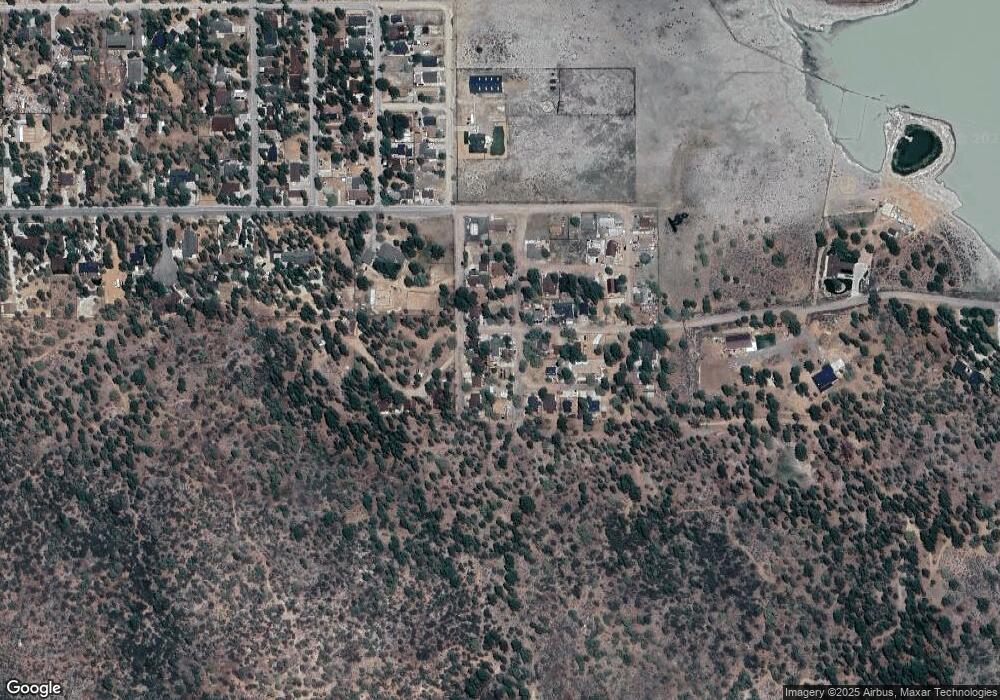
Map
Nearby Homes
- 2737 Cedar Ln
- 2767 Cedar Ln
- 1063 H Ln
- 0 State Ln Unit SR25146675
- 2001 State Ln
- 2805 Cedar Ln
- 2809 Cedar Ln
- 836 D Ln
- 0 Avenue C Unit SR24250416
- 0 Avenue C Unit 25005046
- 0 Avenue C Unit SR24250475
- 0 Avenue C Unit IV25227877
- 820 A Ln
- 901 Ash Ln
- 929 Ash Ln Unit 15
- 929 Ash Ln
- 964 Pine Ln
- 1064 Pine Ln
- 1041 Pine Ln
- 2177 Erwin Ranch Rd