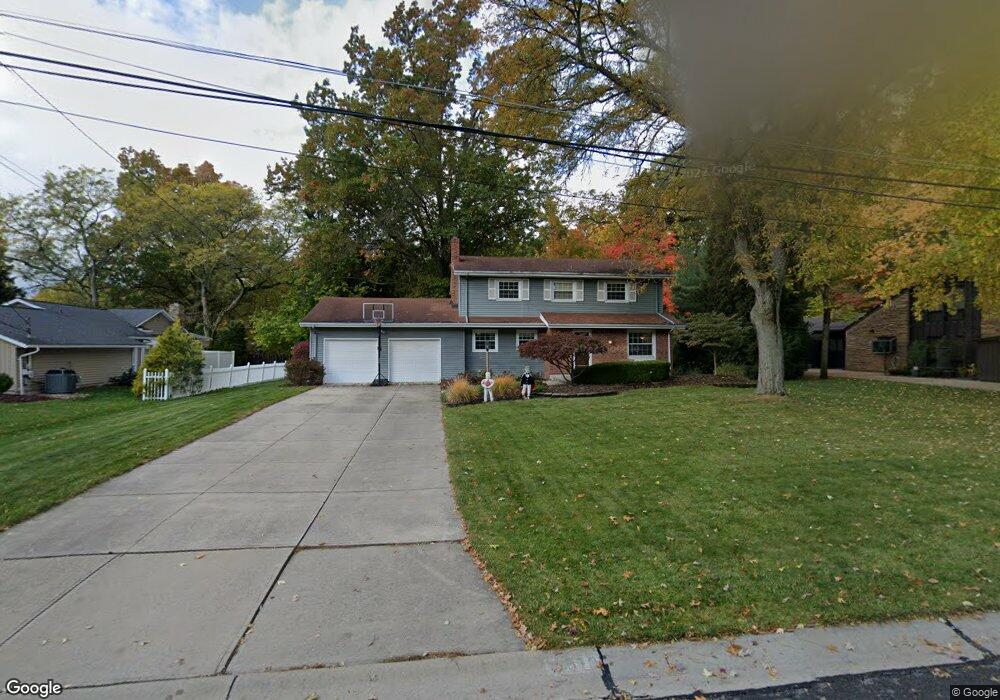
10570 King Coe Ln Strongsville, OH 44149
Estimated Value: $352,000 - $380,000
4
Beds
3
Baths
2,102
Sq Ft
$174/Sq Ft
Est. Value
About This Home
This home is located at 10570 King Coe Ln, Strongsville, OH 44149 and is currently estimated at $366,007, approximately $174 per square foot. 10570 King Coe Ln is a home located in Cuyahoga County with nearby schools including Strongsville High School and Sts Joseph & John Interparochial School.
Ownership History
Date
Name
Owned For
Owner Type
Purchase Details
Closed on
Jul 27, 2004
Sold by
Baskey Lee H and Baskey Cathleen M
Bought by
Puntel Shelley J
Current Estimated Value
Home Financials for this Owner
Home Financials are based on the most recent Mortgage that was taken out on this home.
Original Mortgage
$152,000
Outstanding Balance
$71,596
Interest Rate
5.25%
Mortgage Type
New Conventional
Estimated Equity
$294,411
Purchase Details
Closed on
Apr 28, 1998
Sold by
Rinaldi Edward R
Bought by
Baskey Lee H and Baskey Cathleen M
Home Financials for this Owner
Home Financials are based on the most recent Mortgage that was taken out on this home.
Original Mortgage
$140,800
Interest Rate
7.18%
Purchase Details
Closed on
Dec 22, 1983
Sold by
Kleinert Elizabeth G
Bought by
Rinaldi Edward R
Purchase Details
Closed on
Jan 1, 1975
Bought by
Kleinert Elizabeth G
Create a Home Valuation Report for This Property
The Home Valuation Report is an in-depth analysis detailing your home's value as well as a comparison with similar homes in the area
Home Values in the Area
Average Home Value in this Area
Purchase History
| Date | Buyer | Sale Price | Title Company |
|---|---|---|---|
| Puntel Shelley J | $190,000 | Old Republic | |
| Baskey Lee H | -- | -- | |
| Rinaldi Edward R | $90,000 | -- | |
| Kleinert Elizabeth G | -- | -- |
Source: Public Records
Mortgage History
| Date | Status | Borrower | Loan Amount |
|---|---|---|---|
| Open | Puntel Shelley J | $152,000 | |
| Previous Owner | Baskey Lee H | $140,800 | |
| Closed | Puntel Shelley J | $28,500 |
Source: Public Records
Tax History Compared to Growth
Tax History
| Year | Tax Paid | Tax Assessment Tax Assessment Total Assessment is a certain percentage of the fair market value that is determined by local assessors to be the total taxable value of land and additions on the property. | Land | Improvement |
|---|---|---|---|---|
| 2024 | $5,064 | $107,870 | $21,910 | $85,960 |
| 2023 | $4,997 | $79,800 | $18,690 | $61,110 |
| 2022 | $4,960 | $79,800 | $18,690 | $61,110 |
| 2021 | $4,921 | $79,800 | $18,690 | $61,110 |
| 2020 | $4,880 | $70,000 | $16,380 | $53,620 |
| 2019 | $4,736 | $200,000 | $46,800 | $153,200 |
| 2018 | $4,398 | $70,000 | $16,380 | $53,620 |
| 2017 | $4,581 | $69,060 | $13,370 | $55,690 |
| 2016 | $4,544 | $69,060 | $13,370 | $55,690 |
| 2015 | $4,476 | $69,060 | $13,370 | $55,690 |
| 2014 | $4,476 | $67,070 | $12,990 | $54,080 |
Source: Public Records
Map
Nearby Homes
- 19240 Briarwood Ln
- 10986 Fawn Meadow Ln
- 11179 Fawn Meadow Ln
- 19890 Idlewood Trail
- 11432 Pearl Rd
- 11499 Pearl Rd Unit A106
- 19997 Idlewood Trail
- 20050 Idlewood Trail
- 20424 Scotch Pine Way
- 9401 Pheasant Run Place
- 18433 Whitney Rd
- 11650 River Moss Rd
- 18336 Falling Water Rd
- 20684 Albion Rd
- 12385 Corinth Ct
- 12539 Olympus Way
- 12647 Edgepark Cir
- 10839 Prospect Rd
- 12694 Ionia Ct
- 17945 Cliffside Dr
- 10612 King Coe Ln
- 10526 King Coe Ln
- 10567 Jerry Coe Ln
- 10660 King Coe Ln
- 10480 King Coe Ln
- 10575 King Coe Ln
- 10567 King Coe Ln
- 10613 Jerry Coe Ln
- 10617 King Coe Ln
- 10485 King Coe Ln
- 10702 King Coe Ln
- 10617 Jerry Coe Ln
- 19162 Albion Rd
- 10665 King Coe Ln
- 10432 King Coe Ln
- 10385 King Coe Ln
- 10437 King Coe Ln
- 10665 Jerry Coe Ln
- 10484 Jerry Coe Ln
- 10570 Jerry Coe Ln