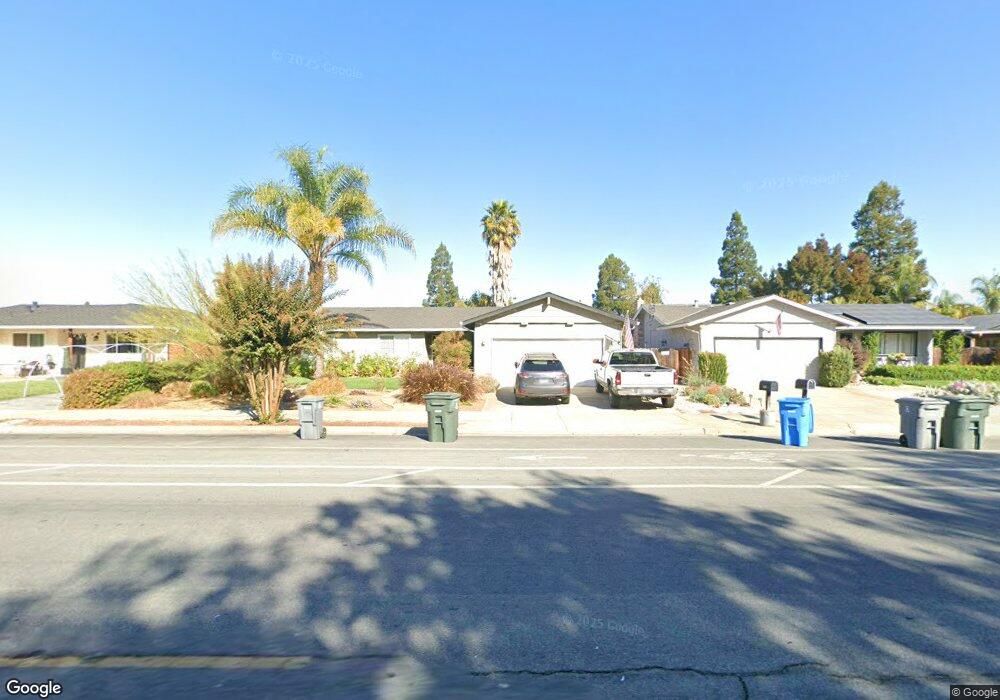
1059 Welburn Ave Gilroy, CA 95020
Las Animas NeighborhoodEstimated Value: $861,000 - $963,000
3
Beds
2
Baths
1,532
Sq Ft
$589/Sq Ft
Est. Value
About This Home
This home is located at 1059 Welburn Ave, Gilroy, CA 95020 and is currently estimated at $902,861, approximately $589 per square foot. 1059 Welburn Ave is a home located in Santa Clara County with nearby schools including Rod Kelley Elementary School, South Valley Middle School, and Solorsano Middle School.
Ownership History
Date
Name
Owned For
Owner Type
Purchase Details
Closed on
Jan 20, 2009
Sold by
Stewart Steven E and Stewart Stephanie B
Bought by
Whitney Candice A
Current Estimated Value
Home Financials for this Owner
Home Financials are based on the most recent Mortgage that was taken out on this home.
Original Mortgage
$379,008
Outstanding Balance
$238,009
Interest Rate
5.14%
Mortgage Type
FHA
Estimated Equity
$664,852
Purchase Details
Closed on
Oct 10, 2008
Sold by
Topete Carmen
Bought by
Stewart Steven E and Stewart Stephanie B
Purchase Details
Closed on
Dec 18, 2006
Sold by
Topete Carmen
Bought by
Topete Carmen
Home Financials for this Owner
Home Financials are based on the most recent Mortgage that was taken out on this home.
Original Mortgage
$280,000
Interest Rate
6.22%
Mortgage Type
New Conventional
Purchase Details
Closed on
Dec 9, 2002
Sold by
Larsen Evelyn
Bought by
The County Of Santa Clara
Create a Home Valuation Report for This Property
The Home Valuation Report is an in-depth analysis detailing your home's value as well as a comparison with similar homes in the area
Home Values in the Area
Average Home Value in this Area
Purchase History
| Date | Buyer | Sale Price | Title Company |
|---|---|---|---|
| Whitney Candice A | $386,000 | Old Republic Title Company | |
| Stewart Steven E | $322,019 | None Available | |
| Topete Carmen | -- | Financial Title Company | |
| The County Of Santa Clara | -- | -- |
Source: Public Records
Mortgage History
| Date | Status | Borrower | Loan Amount |
|---|---|---|---|
| Open | Whitney Candice A | $379,008 | |
| Previous Owner | Topete Carmen | $280,000 |
Source: Public Records
Tax History Compared to Growth
Tax History
| Year | Tax Paid | Tax Assessment Tax Assessment Total Assessment is a certain percentage of the fair market value that is determined by local assessors to be the total taxable value of land and additions on the property. | Land | Improvement |
|---|---|---|---|---|
| 2025 | $6,015 | $497,059 | $225,351 | $271,708 |
| 2024 | $6,015 | $487,314 | $220,933 | $266,381 |
| 2023 | $5,978 | $477,759 | $216,601 | $261,158 |
| 2022 | $5,878 | $468,392 | $212,354 | $256,038 |
| 2021 | $5,850 | $459,209 | $208,191 | $251,018 |
| 2020 | $5,785 | $454,502 | $206,057 | $248,445 |
| 2019 | $5,730 | $445,591 | $202,017 | $243,574 |
| 2018 | $5,350 | $436,855 | $198,056 | $238,799 |
| 2017 | $5,461 | $428,290 | $194,173 | $234,117 |
| 2016 | $5,347 | $419,893 | $190,366 | $229,527 |
| 2015 | $5,044 | $413,587 | $187,507 | $226,080 |
| 2014 | $5,011 | $405,486 | $183,834 | $221,652 |
Source: Public Records
Map
Nearby Homes
- 958 Bosco Ln Unit 1603
- 8190 Westwood Dr
- 8170 Westwood Dr Unit 22
- 1297 Chesbro Way
- 796 Gary St
- 1206 Sycamore Ct
- 7950 English Oak Cir
- 8120 Catalina Ct
- 780 Welburn Ave
- 1555 Hecker Pass Rd Unit D201
- 7934 Spanish Oak Cir
- 714 Sullivan Way
- 722 Carver Place
- 751 La Paloma Way
- 1355 Cypress Ct
- 670 Wickham Ct
- 1544 Rosette Way Unit 27
- 970 Ortega Cir
- 1620 Welburn Ave
- 8255 Rancho Real
- 1039 Welburn Ave
- 1079 Welburn Ave
- 990 Hoesch Way
- 980 Hoesch Way
- 1029 Welburn Ave
- 1099 Welburn Ave
- 1000 Hoesch Way
- 970 Hoesch Way
- 1010 Hoesch Way
- 960 Hoesch Way
- 1045 Fillippelli Dr
- 1035 Fillippelli Dr
- 1005 Fillippelli Dr
- 1075 Fillippelli Dr
- 1009 Welburn Ave
- 1109 Welburn Ave
- 1085 Fillippelli Dr
- 1020 Hoesch Way
- 950 Hoesch Way
- 981 Hoesch Way