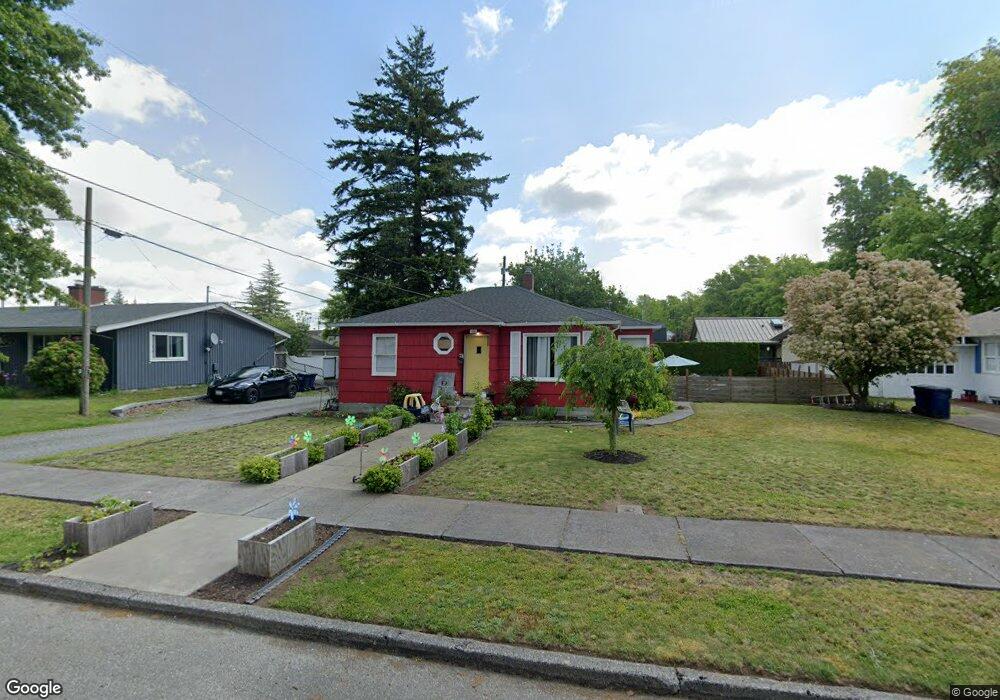
106 15th St Lynden, WA 98264
Estimated Value: $440,866 - $486,000
3
Beds
1
Bath
987
Sq Ft
$467/Sq Ft
Est. Value
About This Home
This home is located at 106 15th St, Lynden, WA 98264 and is currently estimated at $460,717, approximately $466 per square foot. 106 15th St is a home located in Whatcom County with nearby schools including Lynden High School, Lynden Christian School, and Lynden Christian Schools: Administration.
Ownership History
Date
Name
Owned For
Owner Type
Purchase Details
Closed on
Feb 20, 2020
Sold by
Statkenburg Coltin and Starkenburg Gabrielle
Bought by
Prink Benjamin and Prink Angela Gasparini
Current Estimated Value
Home Financials for this Owner
Home Financials are based on the most recent Mortgage that was taken out on this home.
Original Mortgage
$293,037
Outstanding Balance
$259,464
Interest Rate
3.6%
Mortgage Type
New Conventional
Estimated Equity
$201,253
Purchase Details
Closed on
Dec 24, 2017
Sold by
Holleman Arlan D and Holleman Delores K
Bought by
Starkenburg Coltin
Home Financials for this Owner
Home Financials are based on the most recent Mortgage that was taken out on this home.
Original Mortgage
$183,150
Interest Rate
3.95%
Mortgage Type
New Conventional
Create a Home Valuation Report for This Property
The Home Valuation Report is an in-depth analysis detailing your home's value as well as a comparison with similar homes in the area
Home Values in the Area
Average Home Value in this Area
Purchase History
| Date | Buyer | Sale Price | Title Company |
|---|---|---|---|
| Prink Benjamin | $302,100 | Whatcom Land Title Co Inc | |
| Starkenburg Coltin | $203,500 | None Available |
Source: Public Records
Mortgage History
| Date | Status | Borrower | Loan Amount |
|---|---|---|---|
| Open | Prink Benjamin | $293,037 | |
| Previous Owner | Starkenburg Coltin | $183,150 |
Source: Public Records
Tax History Compared to Growth
Tax History
| Year | Tax Paid | Tax Assessment Tax Assessment Total Assessment is a certain percentage of the fair market value that is determined by local assessors to be the total taxable value of land and additions on the property. | Land | Improvement |
|---|---|---|---|---|
| 2024 | $2,867 | $398,455 | $218,250 | $180,205 |
| 2023 | $2,867 | $398,274 | $225,000 | $173,274 |
| 2022 | $2,298 | $301,191 | $118,685 | $182,506 |
| 2021 | $2,254 | $248,916 | $98,086 | $150,830 |
| 2020 | $1,975 | $222,252 | $87,579 | $134,673 |
| 2019 | $1,757 | $203,862 | $80,412 | $123,450 |
| 2018 | $1,921 | $185,894 | $73,252 | $112,642 |
| 2017 | $1,715 | $166,856 | $65,750 | $101,106 |
| 2016 | $1,624 | $158,486 | $60,500 | $97,986 |
| 2015 | $1,440 | $149,186 | $58,190 | $90,996 |
| 2014 | -- | $144,129 | $56,210 | $87,919 |
| 2013 | -- | $142,919 | $55,000 | $87,919 |
Source: Public Records
Map
Nearby Homes
- 1510 E St
- 1218 Front St
- 2016 Steelhead Way
- 1717 E St
- 314 S 16th St
- 403 17th St
- 210 Stremler Dr
- 0 Guide Meridian Unit NWM2369980
- 908 Liberty St
- 106 Fairside Dr Unit D
- 915 Front St
- 410 10th St
- 515 17th St
- 1774 Farmview Terrace
- 1584 Main St
- 1710 Farmview Terrace
- 706 Judson St Unit B
- 706 Judson St Unit A
- 518 Edson St
- 1882 Front St Unit B208