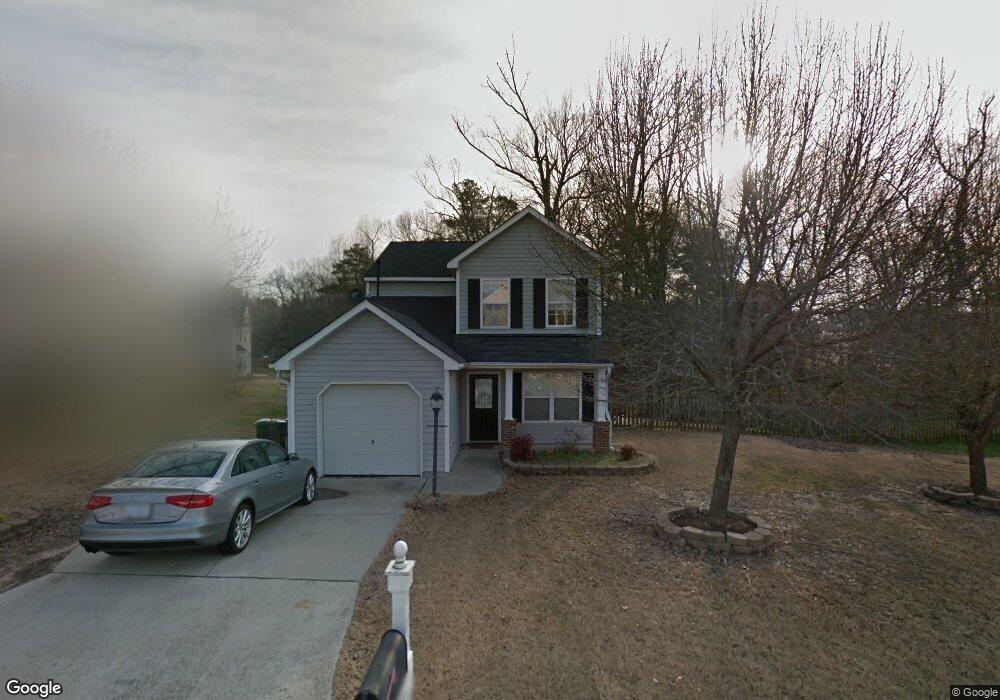
106 Bermuda Green Dr Durham, NC 27703
Eastern Durham NeighborhoodEstimated Value: $347,000 - $366,000
4
Beds
2
Baths
1,404
Sq Ft
$256/Sq Ft
Est. Value
About This Home
This home is located at 106 Bermuda Green Dr, Durham, NC 27703 and is currently estimated at $359,688, approximately $256 per square foot. 106 Bermuda Green Dr is a home located in Durham County with nearby schools including Oak Grove Elementary, John W Neal Middle School, and Southern School of Energy & Sustainability.
Ownership History
Date
Name
Owned For
Owner Type
Purchase Details
Closed on
Oct 5, 2018
Sold by
King Julian S and King Amber M
Bought by
Massia Aislinn and Hatcher Sean
Current Estimated Value
Home Financials for this Owner
Home Financials are based on the most recent Mortgage that was taken out on this home.
Original Mortgage
$182,305
Outstanding Balance
$158,981
Interest Rate
4.5%
Mortgage Type
New Conventional
Estimated Equity
$200,707
Purchase Details
Closed on
Jun 15, 2006
Sold by
Hodges Scott and Hodges Audra
Bought by
King Julian S and King Amber M
Home Financials for this Owner
Home Financials are based on the most recent Mortgage that was taken out on this home.
Original Mortgage
$143,000
Interest Rate
6.51%
Mortgage Type
VA
Purchase Details
Closed on
Oct 28, 2002
Sold by
D R Horton Inc Torrey
Bought by
Hodges Scott and Hodges Audra
Home Financials for this Owner
Home Financials are based on the most recent Mortgage that was taken out on this home.
Original Mortgage
$128,900
Interest Rate
6%
Create a Home Valuation Report for This Property
The Home Valuation Report is an in-depth analysis detailing your home's value as well as a comparison with similar homes in the area
Home Values in the Area
Average Home Value in this Area
Purchase History
| Date | Buyer | Sale Price | Title Company |
|---|---|---|---|
| Massia Aislinn | $192,000 | None Available | |
| King Julian S | $140,000 | None Available | |
| Hodges Scott | $129,000 | -- |
Source: Public Records
Mortgage History
| Date | Status | Borrower | Loan Amount |
|---|---|---|---|
| Open | Massia Aislinn | $182,305 | |
| Previous Owner | King Julian S | $143,000 | |
| Previous Owner | Hodges Scott | $128,900 |
Source: Public Records
Tax History Compared to Growth
Tax History
| Year | Tax Paid | Tax Assessment Tax Assessment Total Assessment is a certain percentage of the fair market value that is determined by local assessors to be the total taxable value of land and additions on the property. | Land | Improvement |
|---|---|---|---|---|
| 2025 | $3,493 | $352,363 | $93,000 | $259,363 |
| 2024 | $2,637 | $189,072 | $41,052 | $148,020 |
| 2023 | $2,477 | $189,072 | $41,052 | $148,020 |
| 2022 | $2,420 | $189,072 | $41,052 | $148,020 |
| 2021 | $2,409 | $189,072 | $41,052 | $148,020 |
| 2020 | $2,352 | $189,072 | $41,052 | $148,020 |
| 2019 | $2,352 | $189,072 | $41,052 | $148,020 |
| 2018 | $2,023 | $149,100 | $34,100 | $115,000 |
| 2017 | $1,905 | $141,488 | $34,100 | $107,388 |
| 2016 | $1,841 | $141,488 | $34,100 | $107,388 |
| 2015 | $1,929 | $139,326 | $33,511 | $105,815 |
| 2014 | $1,929 | $139,326 | $33,511 | $105,815 |
Source: Public Records
Map
Nearby Homes
- 103 Bermuda Green Dr
- 1 Thorn Brook Ct
- 106 Newberry Ln
- 110 Kindlewood Dr
- 10 Autrey Mill Cir
- 4 Fire Rock Place
- 5409 Hadrian Dr
- 208 Lick Creek Ln
- 5609 Thistlerock Ln
- 2117 Fletchers Ridge Dr
- 402 Robbins Rd
- 406 Robbins Rd
- 301 Sylvias Ct
- 2800-2809 Napoli Dr
- 1 Kings Grant Ct
- 31 S Angela Cir
- 416 Chivalry Dr
- 4 N Berrymeadow Ln
- 4807 Tyne Dr
- 612 Chivalry Dr
- 108 Bermuda Green Dr
- 2 Epping Ct
- 104 Bermuda Green Dr
- 4 Epping Ct
- 102 Bermuda Green Dr
- 105 BERMUDA To Be Added
- 105 Bermuda Green Dr
- 107 BERMUDA To Be Added
- 107 Bermuda Green Dr
- 6 Epping Ct
- 201 Bermuda Green Dr
- 1 Epping Ct
- BQ179 Bermuda Green Dr
- 101 Bermuda Green Dr
- 3 Epping Ct
- 7 Kimbrough Ct
- 8 Epping Ct
- 9 Kimbrough Ct
- 5 KIMBROUG To Be Added
- 5 KIMBROUGH CT To Be Added