Estimated Value: $467,000 - $664,000
3
Beds
2
Baths
1,512
Sq Ft
$361/Sq Ft
Est. Value
About This Home
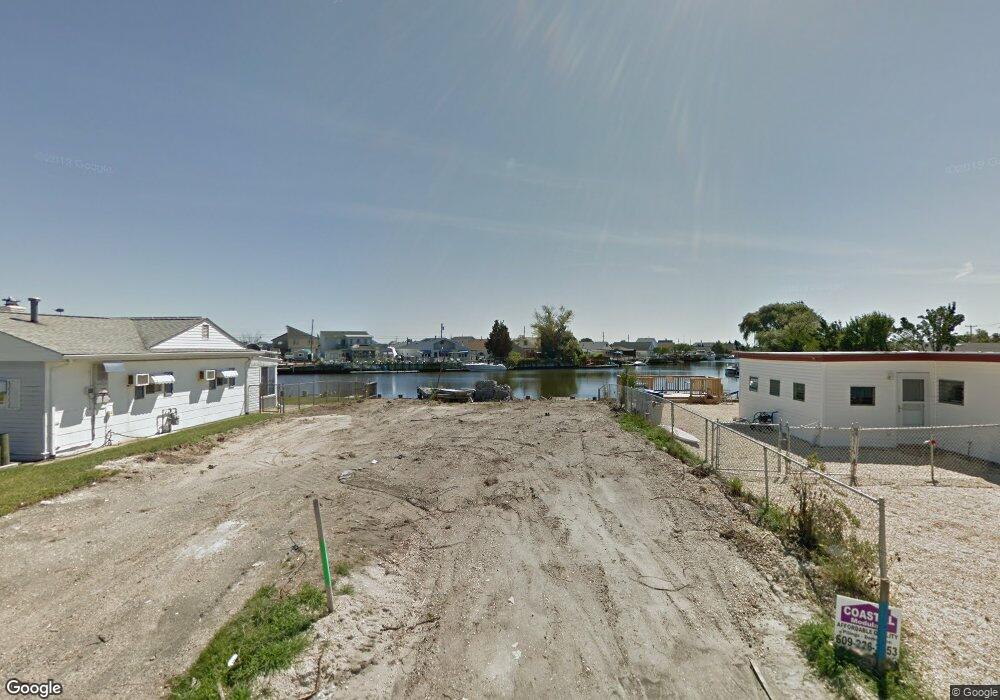
This home is located at 106 E Sail Dr, Little Egg Harbor Township, NJ 08087 and is currently estimated at $546,288, approximately $361 per square foot. 106 E Sail Dr is a home located in Ocean County with nearby schools including George J. Mitchell Elementary School, Pinelands Regional Junior High School, and Pinelands Regional High School.
Ownership History
Date
Name
Owned For
Owner Type
Purchase Details
Closed on
Dec 20, 2017
Sold by
Ocean County Tax Collector
Bought by
Trystone Capital Assets Llc
Current Estimated Value
Purchase Details
Closed on
Feb 18, 2008
Sold by
Omara Shawn and Omara Carolyn
Bought by
Omara Timothy and Omara Debi
Purchase Details
Closed on
Dec 30, 1998
Sold by
Schmitt Joseph P
Bought by
Omara Shawn and Omara Carolyn
Home Financials for this Owner
Home Financials are based on the most recent Mortgage that was taken out on this home.
Original Mortgage
$48,900
Interest Rate
6.7%
Create a Home Valuation Report for This Property
The Home Valuation Report is an in-depth analysis detailing your home's value as well as a comparison with similar homes in the area
Home Values in the Area
Average Home Value in this Area
Purchase History
| Date | Buyer | Sale Price | Title Company |
|---|---|---|---|
| Trystone Capital Assets Llc | -- | -- | |
| Omara Timothy | -- | None Available | |
| Omara Shawn | $69,900 | -- |
Source: Public Records
Mortgage History
| Date | Status | Borrower | Loan Amount |
|---|---|---|---|
| Previous Owner | Omara Shawn | $48,900 |
Source: Public Records
Tax History Compared to Growth
Tax History
| Year | Tax Paid | Tax Assessment Tax Assessment Total Assessment is a certain percentage of the fair market value that is determined by local assessors to be the total taxable value of land and additions on the property. | Land | Improvement |
|---|---|---|---|---|
| 2025 | $6,528 | $225,200 | $80,000 | $145,200 |
| 2024 | $6,260 | $221,600 | $80,000 | $141,600 |
| 2023 | $6,063 | $221,600 | $80,000 | $141,600 |
| 2022 | $6,063 | $221,600 | $80,000 | $141,600 |
| 2021 | $5,723 | $221,600 | $80,000 | $141,600 |
| 2020 | $5,855 | $221,600 | $80,000 | $141,600 |
| 2019 | $5,651 | $221,600 | $80,000 | $141,600 |
| 2018 | $5,332 | $221,600 | $80,000 | $141,600 |
| 2017 | $5,265 | $221,600 | $80,000 | $141,600 |
| 2016 | $5,298 | $221,600 | $80,000 | $141,600 |
| 2015 | $5,361 | $211,500 | $80,000 | $131,500 |
| 2014 | $4,067 | $150,500 | $150,500 | $0 |
Source: Public Records
Map
Nearby Homes