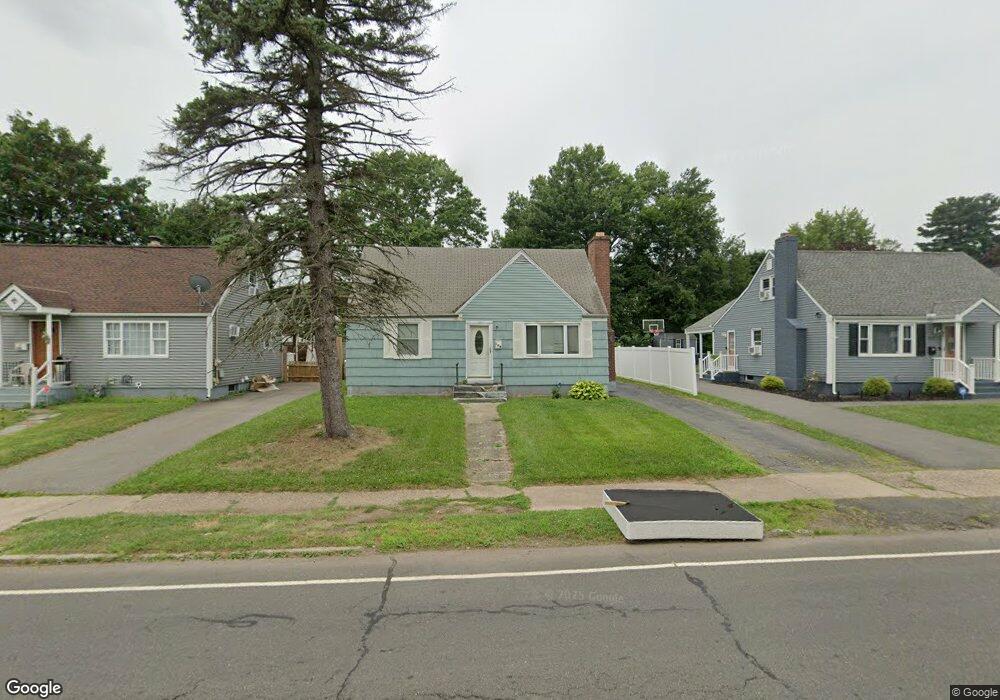
106 East St New Britain, CT 06051
Estimated Value: $266,322 - $312,000
4
Beds
1
Bath
1,334
Sq Ft
$209/Sq Ft
Est. Value
About This Home
This home is located at 106 East St, New Britain, CT 06051 and is currently estimated at $278,581, approximately $208 per square foot. 106 East St is a home located in Hartford County with nearby schools including Slade Middle School, St Paul School, and Raymond Hill School.
Ownership History
Date
Name
Owned For
Owner Type
Purchase Details
Closed on
Sep 16, 1997
Sold by
Litke Thomas and Litke Lisa
Bought by
Santiago Ramon and Santiago Luz
Current Estimated Value
Home Financials for this Owner
Home Financials are based on the most recent Mortgage that was taken out on this home.
Original Mortgage
$75,100
Interest Rate
7.31%
Mortgage Type
Unknown
Purchase Details
Closed on
Apr 27, 1994
Sold by
Ge Capital Asset Mmgt
Bought by
Mete Charlene
Home Financials for this Owner
Home Financials are based on the most recent Mortgage that was taken out on this home.
Original Mortgage
$10,000
Interest Rate
7.7%
Purchase Details
Closed on
Jan 18, 1989
Sold by
Beers William J
Bought by
Litke Thomas
Home Financials for this Owner
Home Financials are based on the most recent Mortgage that was taken out on this home.
Original Mortgage
$98,800
Interest Rate
10.38%
Create a Home Valuation Report for This Property
The Home Valuation Report is an in-depth analysis detailing your home's value as well as a comparison with similar homes in the area
Home Values in the Area
Average Home Value in this Area
Purchase History
| Date | Buyer | Sale Price | Title Company |
|---|---|---|---|
| Santiago Ramon | $77,000 | -- | |
| Mete Charlene | $35,000 | -- | |
| Litke Thomas | $124,000 | -- |
Source: Public Records
Mortgage History
| Date | Status | Borrower | Loan Amount |
|---|---|---|---|
| Open | Litke Thomas | $98,000 | |
| Closed | Litke Thomas | $75,100 | |
| Previous Owner | Litke Thomas | $10,000 | |
| Previous Owner | Litke Thomas | $98,800 | |
| Closed | Litke Thomas | $3,300 |
Source: Public Records
Tax History Compared to Growth
Tax History
| Year | Tax Paid | Tax Assessment Tax Assessment Total Assessment is a certain percentage of the fair market value that is determined by local assessors to be the total taxable value of land and additions on the property. | Land | Improvement |
|---|---|---|---|---|
| 2025 | $4,775 | $121,870 | $34,440 | $87,430 |
| 2024 | $4,825 | $121,870 | $34,440 | $87,430 |
| 2023 | $4,665 | $121,870 | $34,440 | $87,430 |
| 2022 | $4,231 | $85,470 | $15,890 | $69,580 |
| 2021 | $4,231 | $85,470 | $15,890 | $69,580 |
| 2020 | $4,316 | $85,470 | $15,890 | $69,580 |
| 2019 | $4,316 | $85,470 | $15,890 | $69,580 |
| 2018 | $4,316 | $85,470 | $15,890 | $69,580 |
| 2017 | $3,952 | $78,260 | $15,890 | $62,370 |
| 2016 | $3,952 | $78,260 | $15,890 | $62,370 |
| 2015 | $3,835 | $78,260 | $15,890 | $62,370 |
| 2014 | $3,835 | $78,260 | $15,890 | $62,370 |
Source: Public Records
Map
Nearby Homes