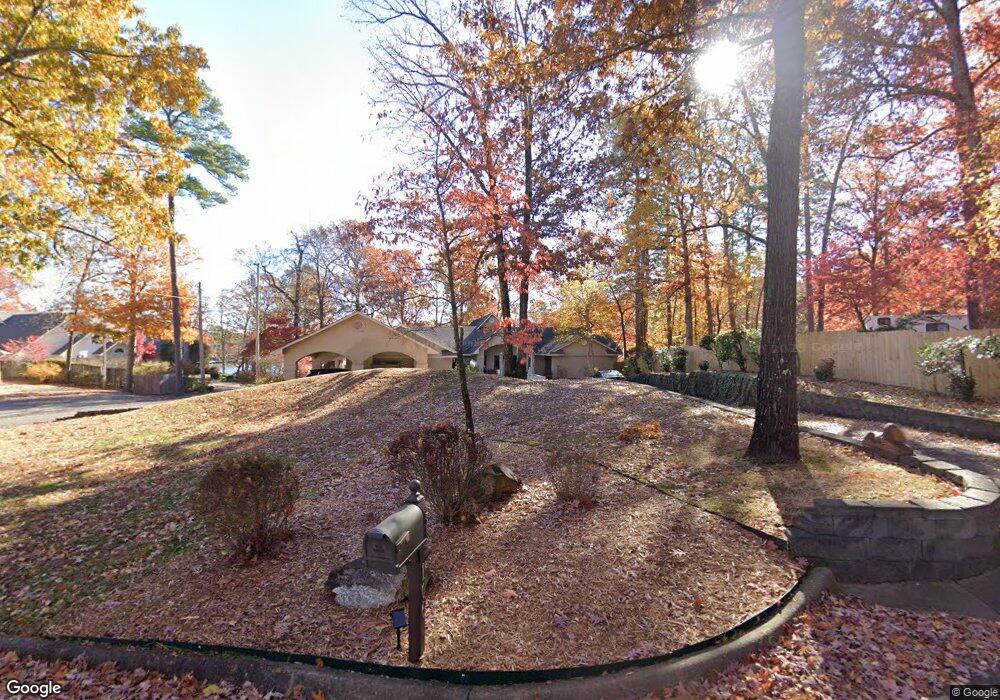
106 Gene Bell Cove Hot Springs National Park, AR 71913
Estimated Value: $898,000 - $1,000,883
3
Beds
4
Baths
3,608
Sq Ft
$261/Sq Ft
Est. Value
About This Home
This home is located at 106 Gene Bell Cove, Hot Springs National Park, AR 71913 and is currently estimated at $942,961, approximately $261 per square foot. 106 Gene Bell Cove is a home located in Garland County with nearby schools including Lake Hamilton Primary School, Lake Hamilton Elementary School, and Lake Hamilton Interm. School.
Ownership History
Date
Name
Owned For
Owner Type
Purchase Details
Closed on
Oct 6, 2021
Sold by
Cole Fabious
Bought by
Roper Richard Kyle and Roper Jane Ellen
Current Estimated Value
Purchase Details
Closed on
Mar 4, 2021
Sold by
Roper Family Trust and Roper Richard Kyle
Bought by
Roper Richard Kyle and Roper Jane Ellen
Home Financials for this Owner
Home Financials are based on the most recent Mortgage that was taken out on this home.
Original Mortgage
$297,950
Interest Rate
2.7%
Mortgage Type
New Conventional
Purchase Details
Closed on
Jan 14, 2010
Sold by
Roper Richard Kyle and Roper Jane Ellen
Bought by
Roper Richard Kyle and Roper Jane Ellen
Purchase Details
Closed on
Aug 11, 1997
Sold by
Not Provided
Bought by
Roper Richard Kyle and Roper Jane E
Purchase Details
Closed on
Jan 1, 1901
Bought by
Wooten Leonard E
Create a Home Valuation Report for This Property
The Home Valuation Report is an in-depth analysis detailing your home's value as well as a comparison with similar homes in the area
Home Values in the Area
Average Home Value in this Area
Purchase History
| Date | Buyer | Sale Price | Title Company |
|---|---|---|---|
| Roper Richard Kyle | $85,000 | Hot Springs Title | |
| Roper Richard Kyle | -- | Hot Springs Title | |
| Roper Richard Kyle | -- | Hot Springs Title | |
| Roper Richard Kyle | -- | None Available | |
| Roper Richard Kyle | $240,000 | -- | |
| Wooten Leonard E | -- | -- |
Source: Public Records
Mortgage History
| Date | Status | Borrower | Loan Amount |
|---|---|---|---|
| Previous Owner | Roper Richard Kyle | $297,950 |
Source: Public Records
Tax History Compared to Growth
Tax History
| Year | Tax Paid | Tax Assessment Tax Assessment Total Assessment is a certain percentage of the fair market value that is determined by local assessors to be the total taxable value of land and additions on the property. | Land | Improvement |
|---|---|---|---|---|
| 2025 | $4,321 | $166,860 | $44,000 | $122,860 |
| 2024 | $4,152 | $166,860 | $44,000 | $122,860 |
| 2023 | $4,024 | $166,860 | $44,000 | $122,860 |
| 2022 | $4,322 | $166,860 | $44,000 | $122,860 |
| 2021 | $4,142 | $92,350 | $37,400 | $54,950 |
| 2020 | $3,607 | $92,350 | $37,400 | $54,950 |
| 2019 | $3,384 | $92,350 | $37,400 | $54,950 |
| 2018 | $3,245 | $92,350 | $37,400 | $54,950 |
| 2017 | $3,082 | $92,350 | $37,400 | $54,950 |
| 2016 | $2,918 | $100,960 | $33,000 | $67,960 |
| 2015 | $2,788 | $100,960 | $33,000 | $67,960 |
| 2014 | $2,656 | $68,028 | $12,244 | $55,784 |
Source: Public Records
Map
Nearby Homes
- 128 Waterview Dr
- 215 Osprey Dr
- 208 Southshore Dr
- 531 Northshore Dr
- 156 Osprey Dr
- 188 Carl Finch Rd
- 164 Blue Heron Dr
- 000 Osprey Point
- 126 Southshore Dr
- TBD Waterview Dr
- 100 Blue Heron Point
- 150 Cardinal Ct
- 191 Waterview Dr
- 193 Waterview Dr
- TBD Warpath Dr
- 119 Bluebird Ln
- 2325 Marion Anderson Rd
- 112 Bluebird Ln
- 701 Northshore Dr
- 110 Gene Bell Cove
- 112 Gene Bell Cove
- 703 Northshore Dr
- 116 Gene Bell Cove
- 107 Gene Bell Cove
- 105 Gene Bell Cove
- 103 Gene Bell Cove
- AKA 717 Northshore Dr
- PT B LOT 7 Northshore Dr
- PT A LOT 7 Northshore Dr
- 000 Northshore Dr
- 713 Northshore Dr
- 119 Gene Bell Cove
- 740 Northshore Dr Unit 8A
- 740 Northshore Dr
- 118 Gene Bell Cove
- 101 Gene Bell Cove
- 702 Northshore Dr
- 627 Northshore Dr