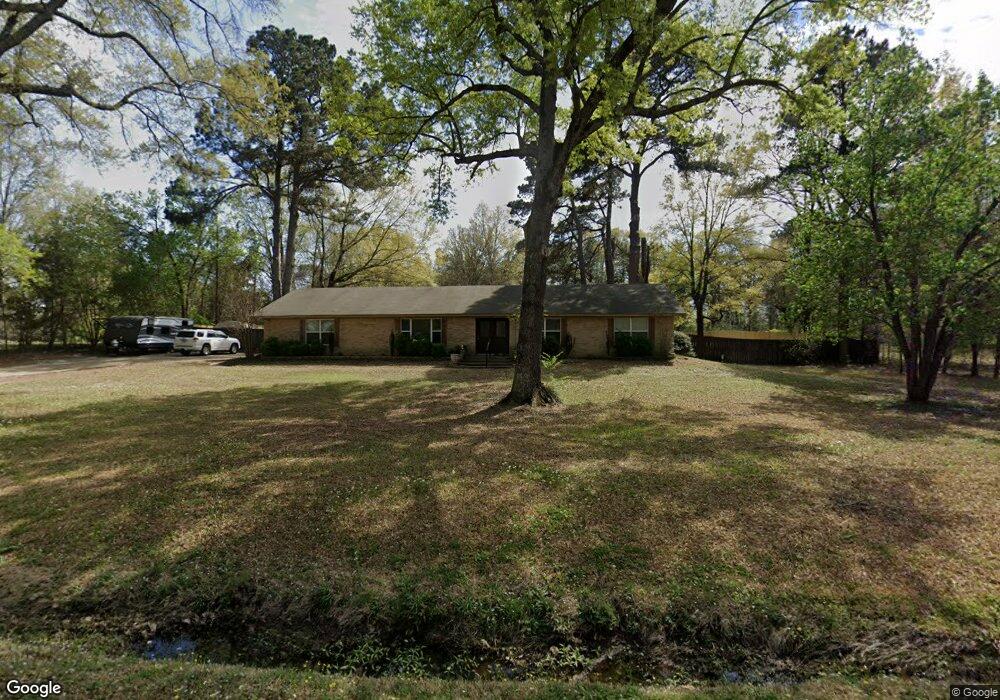
106 Skylark Dr Texarkana, TX 75503
Estimated Value: $249,000 - $284,178
3
Beds
2
Baths
1,932
Sq Ft
$140/Sq Ft
Est. Value
About This Home
This home is located at 106 Skylark Dr, Texarkana, TX 75503 and is currently estimated at $269,795, approximately $139 per square foot. 106 Skylark Dr is a home located in Bowie County with nearby schools including Waggoner Creek Elementary School, Texas Middle School, and Texas High School.
Ownership History
Date
Name
Owned For
Owner Type
Purchase Details
Closed on
Jul 16, 2021
Sold by
Moore Louis J
Bought by
Wiborn Jonathan Edward
Current Estimated Value
Purchase Details
Closed on
Jun 19, 2020
Sold by
Houchens Mark
Bought by
Wiborn Jonathan Edward
Home Financials for this Owner
Home Financials are based on the most recent Mortgage that was taken out on this home.
Original Mortgage
$180,667
Interest Rate
3.2%
Mortgage Type
FHA
Purchase Details
Closed on
Aug 14, 2019
Sold by
Scoggins Cindy D
Bought by
Houchens Mark
Purchase Details
Closed on
Nov 20, 2009
Sold by
Smith Gary W and Smith Amy
Bought by
Scoggins Cindy D
Home Financials for this Owner
Home Financials are based on the most recent Mortgage that was taken out on this home.
Original Mortgage
$101,750
Interest Rate
4.93%
Mortgage Type
FHA
Create a Home Valuation Report for This Property
The Home Valuation Report is an in-depth analysis detailing your home's value as well as a comparison with similar homes in the area
Home Values in the Area
Average Home Value in this Area
Purchase History
| Date | Buyer | Sale Price | Title Company |
|---|---|---|---|
| Wiborn Jonathan Edward | -- | None Available | |
| Wiborn Jonathan Edward | -- | None Available | |
| Houchens Mark | $73,000 | Servicelink Asap | |
| Scoggins Cindy D | -- | Stewart Title |
Source: Public Records
Mortgage History
| Date | Status | Borrower | Loan Amount |
|---|---|---|---|
| Previous Owner | Wiborn Jonathan Edward | $180,667 | |
| Previous Owner | Scoggins Cindy D | $101,750 |
Source: Public Records
Tax History Compared to Growth
Tax History
| Year | Tax Paid | Tax Assessment Tax Assessment Total Assessment is a certain percentage of the fair market value that is determined by local assessors to be the total taxable value of land and additions on the property. | Land | Improvement |
|---|---|---|---|---|
| 2025 | $4,262 | $245,182 | $18,000 | $227,182 |
| 2024 | $4,262 | $246,902 | $18,000 | $228,902 |
| 2023 | $5,531 | $233,573 | $0 | $0 |
| 2022 | $5,069 | $212,339 | $18,000 | $194,339 |
| 2021 | $4,484 | $175,359 | $14,000 | $161,359 |
| 2020 | $4,170 | $162,203 | $14,000 | $148,203 |
| 2019 | $3,042 | $114,053 | $14,000 | $100,053 |
| 2018 | $3,141 | $117,753 | $14,000 | $103,753 |
| 2017 | $3,081 | $115,808 | $14,000 | $101,808 |
| 2016 | $3,003 | $112,879 | $14,000 | $98,879 |
| 2015 | $2,635 | $114,737 | $14,000 | $100,737 |
| 2014 | $2,635 | $113,794 | $14,000 | $99,794 |
Source: Public Records
Map
Nearby Homes
- Lot 1 Blk 2 Cooper Lane Est III
- 3401 Cooper Ln
- 3608 Melody Ln
- 3133 Pleasant Grove Rd
- Lot 1 & Cooper Lane Estates III
- Lot 1 Bl Sylvia Dr
- Lot 7 Cooper Lane Est III
- 6108 Pebble Brook Dr
- 0 HIGH DRIVE High Dr
- 2907 Pleasant Grove Rd
- Lot 1 High -Cooper Lane Estate III Dr
- 5500 Pleasant Grove Rd
- 14-16 Pinto Cir
- 15-17 Pinto Cir
- 6605 Chaparral St
- 6312 Chaparral St
- 180 Ochsenbein Rd
- 21 Dustin Terrace
- TBD N Kings Hwy
- 34 Dustin Terrace
- 100 Skylark Dr
- 110 Skylark Dr
- 115 Skylark Dr
- 105 Skylark Dr
- 3201 Cooper Ln
- 135 Skylark Dr
- 3301 Cooper Ln
- 3045 Pleasant Grove Rd
- 130 Skylark Dr
- 3043 Pleasant Grove Rd
- 3037 Pleasant Grove Rd
- 132 Skylark Dr
- 3041 Pleasant Grove Rd
- 140 Skylark Dr
- 145 Skylark Dr
- 3300 Cooper Ln
- 3305 Cooper Ln
- 3101 Pleasant Grove Rd
- 3304 Cooper Ln
- 150 Skylark Dr