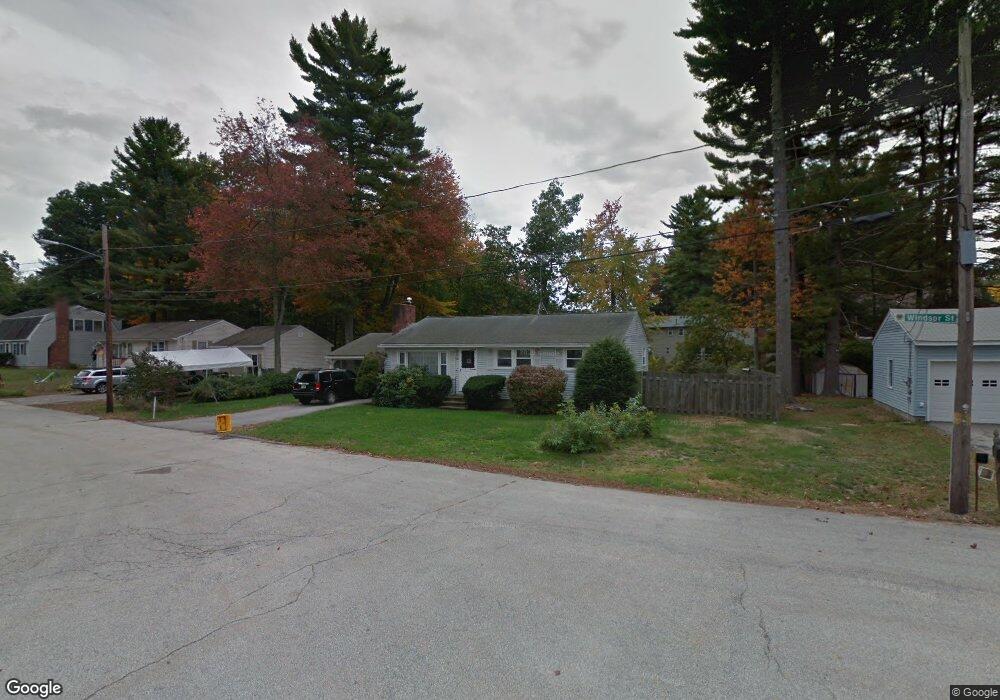
106 Windsor St Nashua, NH 03063
Northwest Nashua NeighborhoodEstimated Value: $476,836 - $544,000
3
Beds
2
Baths
1,176
Sq Ft
$443/Sq Ft
Est. Value
About This Home
This home is located at 106 Windsor St, Nashua, NH 03063 and is currently estimated at $520,959, approximately $442 per square foot. 106 Windsor St is a home located in Hillsborough County with nearby schools including Birch Hill Elementary School, Elm Street Middle School, and Nashua High School North.
Ownership History
Date
Name
Owned For
Owner Type
Purchase Details
Closed on
Feb 24, 2023
Sold by
Tanguay Michelle Y
Bought by
Holland Patricia
Current Estimated Value
Home Financials for this Owner
Home Financials are based on the most recent Mortgage that was taken out on this home.
Original Mortgage
$328,500
Outstanding Balance
$317,468
Interest Rate
6.33%
Mortgage Type
Purchase Money Mortgage
Estimated Equity
$203,491
Purchase Details
Closed on
Oct 29, 2021
Sold by
Daley Pauline A
Bought by
Tanguay Michelle Y
Home Financials for this Owner
Home Financials are based on the most recent Mortgage that was taken out on this home.
Original Mortgage
$270,000
Interest Rate
2.8%
Mortgage Type
Purchase Money Mortgage
Purchase Details
Closed on
Apr 19, 1977
Bought by
Daley Pauline A
Create a Home Valuation Report for This Property
The Home Valuation Report is an in-depth analysis detailing your home's value as well as a comparison with similar homes in the area
Home Values in the Area
Average Home Value in this Area
Purchase History
| Date | Buyer | Sale Price | Title Company |
|---|---|---|---|
| Holland Patricia | $365,000 | None Available | |
| Tanguay Michelle Y | $350,000 | None Available | |
| Daley Pauline A | -- | -- |
Source: Public Records
Mortgage History
| Date | Status | Borrower | Loan Amount |
|---|---|---|---|
| Open | Holland Patricia | $328,500 | |
| Previous Owner | Tanguay Michelle Y | $270,000 |
Source: Public Records
Tax History Compared to Growth
Tax History
| Year | Tax Paid | Tax Assessment Tax Assessment Total Assessment is a certain percentage of the fair market value that is determined by local assessors to be the total taxable value of land and additions on the property. | Land | Improvement |
|---|---|---|---|---|
| 2024 | $7,115 | $447,500 | $145,200 | $302,300 |
| 2023 | $6,854 | $376,000 | $116,200 | $259,800 |
| 2022 | $6,794 | $376,000 | $116,200 | $259,800 |
| 2021 | $6,255 | $269,400 | $77,500 | $191,900 |
| 2020 | $6,091 | $269,400 | $77,500 | $191,900 |
| 2019 | $5,862 | $269,400 | $77,500 | $191,900 |
| 2018 | $5,714 | $269,400 | $77,500 | $191,900 |
| 2017 | $4,885 | $189,400 | $70,500 | $118,900 |
| 2016 | $4,748 | $189,400 | $70,500 | $118,900 |
| 2015 | $4,651 | $189,600 | $70,700 | $118,900 |
| 2014 | $4,560 | $189,600 | $70,700 | $118,900 |
Source: Public Records
Map
Nearby Homes
- 5 Chatfield Dr Unit U18
- 4 Jared Cir Unit U21
- 7 Robert Dr
- 19 Dunloggin Rd
- 239 Broad St
- 74 Profile Cir
- 123 Cannongate III
- 3 Wright Rd
- 44 Broad St
- 2 Broadcrest Ln
- 36 Hampton Dr
- 33 Ferry Rd
- 30 Burgess St
- 11 Amherst Terrace
- 38 Highbridge Hill Rd Unit 186
- 31 Ashland St
- 26 Andover Down Unit 276
- 6 Cornwall Ln Unit 7
- 5 Meghan Dr Unit U23
- 77 Deerwood Dr Unit E