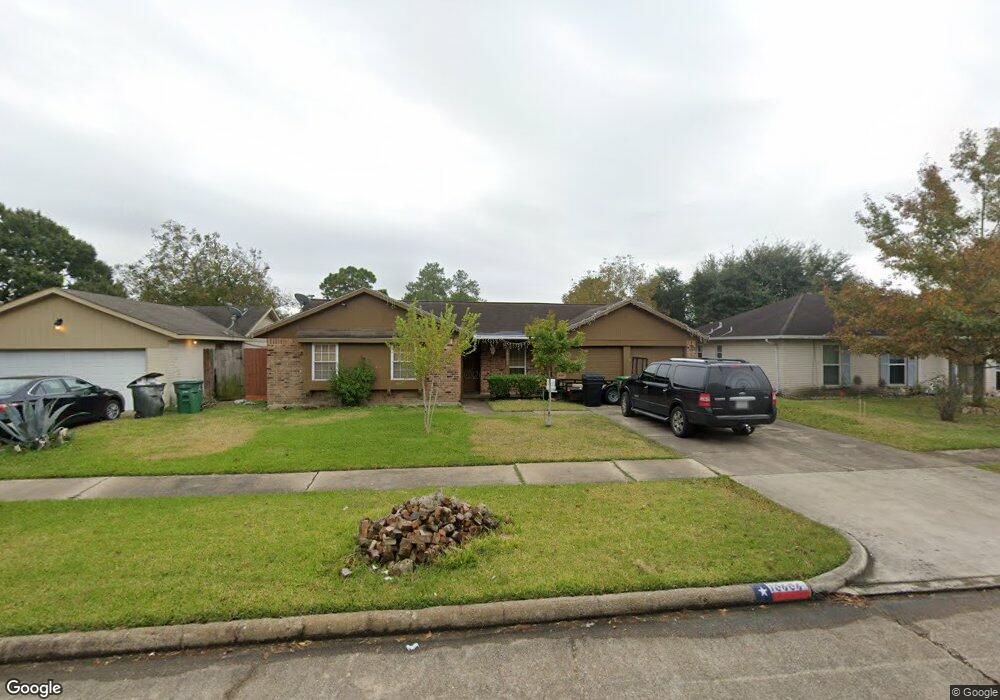
10606 Kirkhill Dr Houston, TX 77089
Southbelt-Ellington NeighborhoodEstimated Value: $226,000 - $237,423
3
Beds
2
Baths
1,382
Sq Ft
$168/Sq Ft
Est. Value
About This Home
This home is located at 10606 Kirkhill Dr, Houston, TX 77089 and is currently estimated at $231,856, approximately $167 per square foot. 10606 Kirkhill Dr is a home located in Harris County with nearby schools including Meador Elementary School, Beverly Hill Intermediate School, and Morris Middle School.
Ownership History
Date
Name
Owned For
Owner Type
Purchase Details
Closed on
Oct 4, 2011
Sold by
Mcghee Kellie Leann and Mcghee Mark
Bought by
Cavazos Luis M
Current Estimated Value
Home Financials for this Owner
Home Financials are based on the most recent Mortgage that was taken out on this home.
Original Mortgage
$104,232
Outstanding Balance
$68,114
Interest Rate
3.25%
Mortgage Type
FHA
Estimated Equity
$163,742
Purchase Details
Closed on
Sep 16, 2009
Sold by
Anderson Matthew O
Bought by
Anderson Kellie L
Purchase Details
Closed on
Apr 25, 2002
Sold by
Rouse Joan
Bought by
Anderson Matthew O and Anderson Kellie L
Home Financials for this Owner
Home Financials are based on the most recent Mortgage that was taken out on this home.
Original Mortgage
$82,450
Interest Rate
7.09%
Create a Home Valuation Report for This Property
The Home Valuation Report is an in-depth analysis detailing your home's value as well as a comparison with similar homes in the area
Home Values in the Area
Average Home Value in this Area
Purchase History
| Date | Buyer | Sale Price | Title Company |
|---|---|---|---|
| Cavazos Luis M | -- | Chicago Title | |
| Anderson Kellie L | -- | None Available | |
| Anderson Matthew O | -- | Texas American Title Company |
Source: Public Records
Mortgage History
| Date | Status | Borrower | Loan Amount |
|---|---|---|---|
| Open | Cavazos Luis M | $104,232 | |
| Previous Owner | Anderson Matthew O | $82,450 | |
| Closed | Anderson Kellie L | $0 |
Source: Public Records
Tax History Compared to Growth
Tax History
| Year | Tax Paid | Tax Assessment Tax Assessment Total Assessment is a certain percentage of the fair market value that is determined by local assessors to be the total taxable value of land and additions on the property. | Land | Improvement |
|---|---|---|---|---|
| 2025 | $3,171 | $205,671 | $41,010 | $164,661 |
| 2024 | $3,171 | $204,256 | $41,010 | $163,246 |
| 2023 | $3,171 | $204,256 | $41,010 | $163,246 |
| 2022 | $5,032 | $196,555 | $41,010 | $155,545 |
| 2021 | $4,317 | $160,697 | $41,010 | $119,687 |
| 2020 | $4,417 | $161,134 | $41,010 | $120,124 |
| 2019 | $4,300 | $157,745 | $34,175 | $123,570 |
| 2018 | $1,561 | $135,591 | $26,315 | $109,276 |
| 2017 | $3,734 | $135,591 | $26,315 | $109,276 |
| 2016 | $3,592 | $130,434 | $26,315 | $104,119 |
| 2015 | $3,004 | $113,442 | $23,923 | $89,519 |
| 2014 | $3,004 | $107,197 | $20,505 | $86,692 |
Source: Public Records
Map
Nearby Homes
- 10519 Kirkglen Dr
- 10507 Kirkhill Dr
- 11433 Sabo Rd
- 12023 Sagecliff Dr
- 11930 Kirkway Dr
- 10614 Sabo Rd
- 10815 Ritow St
- 11107 Kirkpark Dr
- 10442 Southport Dr
- 11111 Sagecrest Ln
- 10906 Green Arbor Dr
- 10823 Overlea Dr
- 11314 Sageland Dr
- 10906 Keese Dr
- 10619 Wheaton Dr
- 11611 Sagedowne Ln
- 11810 Sagedowne Ln
- 11311 Caribbean Ln
- 11414 Kirkwyn Dr
- 10207 Rambling Trail
- 10602 Kirkhill Dr
- 10610 Kirkhill Dr
- 10607 Kirkglen Dr
- 10603 Kirkglen Dr
- 10614 Kirkhill Dr
- 10526 Kirkhill Dr
- 10611 Kirkglen Dr
- 10527 Kirkglen Dr
- 10607 Kirkhill Dr
- 10603 Kirkhill Dr
- 10615 Kirkglen Dr
- 10618 Kirkhill Dr
- 10522 Kirkhill Dr
- 10527 Kirkhill Dr
- 10611 Kirkhill Dr
- 10523 Kirkglen Dr
- 10523 Kirkhill Dr
- 10615 Kirkhill Dr
- 10619 Kirkglen Dr
- 10518 Kirkhill Dr