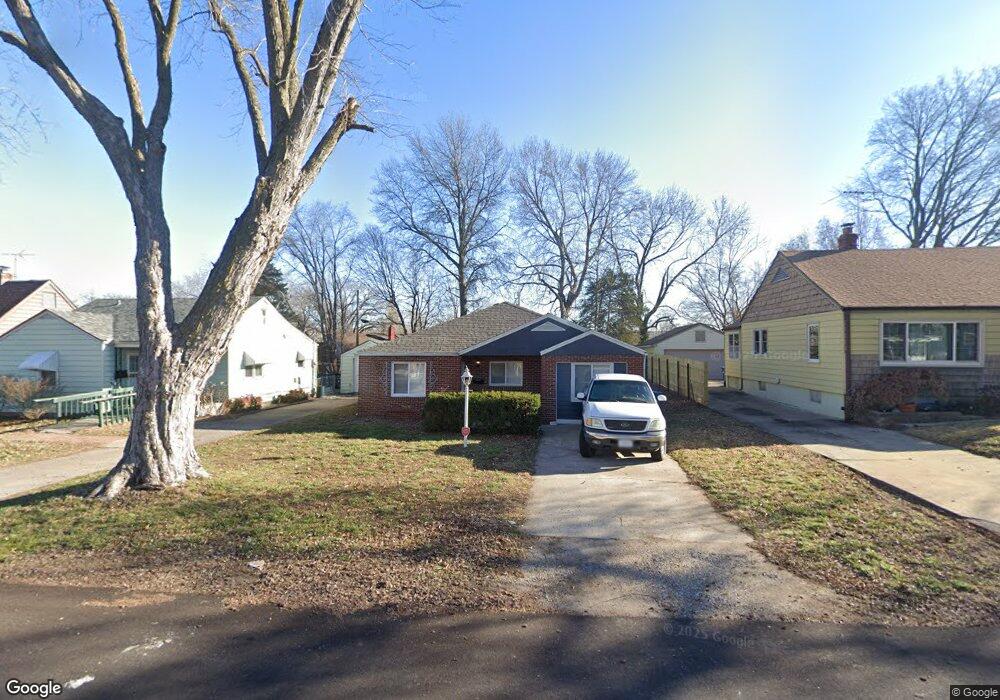
10607 E Lexington Ave Sugar Creek, MO 64054
Estimated Value: $116,000 - $153,000
3
Beds
1
Bath
698
Sq Ft
$187/Sq Ft
Est. Value
About This Home
This home is located at 10607 E Lexington Ave, Sugar Creek, MO 64054 and is currently estimated at $130,628, approximately $187 per square foot. 10607 E Lexington Ave is a home located in Jackson County with nearby schools including Sugar Creek Elementary School, Abraham Mallinson Elementary, and Clifford H. Nowlin Middle School.
Ownership History
Date
Name
Owned For
Owner Type
Purchase Details
Closed on
Feb 23, 2021
Sold by
Rehab Solutions Llc
Bought by
Routh Myles and Routh Myles T
Current Estimated Value
Home Financials for this Owner
Home Financials are based on the most recent Mortgage that was taken out on this home.
Original Mortgage
$88,000
Outstanding Balance
$78,706
Interest Rate
2.7%
Mortgage Type
New Conventional
Estimated Equity
$51,922
Purchase Details
Closed on
Apr 15, 2020
Sold by
All Pro Property Management Llc
Bought by
Rehab Solutions Llc
Purchase Details
Closed on
Jul 18, 2016
Sold by
Barton Gloria J and Barton Gary J
Bought by
All Pro Property Management Llc
Purchase Details
Closed on
Jun 22, 2006
Sold by
Lillard Husley A and Lillard Mary B
Bought by
Barton Gary J and Barton Gloria J
Home Financials for this Owner
Home Financials are based on the most recent Mortgage that was taken out on this home.
Original Mortgage
$65,000
Interest Rate
6.56%
Mortgage Type
Purchase Money Mortgage
Create a Home Valuation Report for This Property
The Home Valuation Report is an in-depth analysis detailing your home's value as well as a comparison with similar homes in the area
Home Values in the Area
Average Home Value in this Area
Purchase History
| Date | Buyer | Sale Price | Title Company |
|---|---|---|---|
| Routh Myles | -- | Alpha Title Guaranty Inc | |
| Rehab Solutions Llc | -- | None Available | |
| All Pro Property Management Llc | $21,000 | None Available | |
| Barton Gary J | -- | Commonwealth Land Title Insu |
Source: Public Records
Mortgage History
| Date | Status | Borrower | Loan Amount |
|---|---|---|---|
| Open | Routh Myles | $88,000 | |
| Previous Owner | Barton Gary J | $65,000 |
Source: Public Records
Tax History Compared to Growth
Tax History
| Year | Tax Paid | Tax Assessment Tax Assessment Total Assessment is a certain percentage of the fair market value that is determined by local assessors to be the total taxable value of land and additions on the property. | Land | Improvement |
|---|---|---|---|---|
| 2025 | $822 | $12,699 | $2,979 | $9,720 |
| 2024 | $797 | $11,045 | $1,697 | $9,348 |
| 2023 | $797 | $11,044 | $1,039 | $10,005 |
| 2022 | $834 | $10,450 | $1,489 | $8,961 |
| 2021 | $830 | $10,450 | $1,489 | $8,961 |
| 2020 | $900 | $9,983 | $1,489 | $8,494 |
| 2019 | $801 | $9,983 | $1,489 | $8,494 |
| 2018 | $716 | $8,689 | $1,296 | $7,393 |
| 2017 | $734 | $8,689 | $1,296 | $7,393 |
| 2016 | $734 | $8,638 | $1,370 | $7,268 |
| 2014 | $697 | $8,386 | $1,330 | $7,056 |
Source: Public Records
Map
Nearby Homes
- 10406 E Lexington Ave
- 501 S Hardy Ave
- 522 S Ralston St
- 529 S Northern Blvd
- 116 units #1-6 S Hedges Ave Unit 1,2,3,4,5,6
- 108 S Hedges St
- 540 S Ash Ave
- 563 S Ash Ave
- 230 S Huttig Ave
- 212 S Huttig Ave
- 549 S Cedar Ave
- 622 S Lake Dr
- 638 S Lake Dr
- 10804 Felton St
- 144 N Hardy Ave
- 805 S Hardy Ave
- 620 S Huttig Ave
- 139 N Cedar Ave
- 11201 E 6th St S
- 132 N Home Ave
- 10605 E Lexington Ave
- 10609 E Lexington Ave
- 10611 E Lexington Ave
- 506 Hedges Ave
- 506 S Hedges St
- 508 S Hedges St
- 500 S Hedges St
- 10602 E Lexington Ave
- 10604 E Lexington Ave
- 10603 E Lexington Ave
- 510 S Hedges St
- 10600 E Lexington Ave
- 503 S Ralston St
- 10608 E Lexington Ave
- 514 S Hedges St
- 10610 E Lexington Ave
- 509 S Hedges St
- 505 S Hedges St
- 505 S Ralston St
- 10700 E Lexington Ave