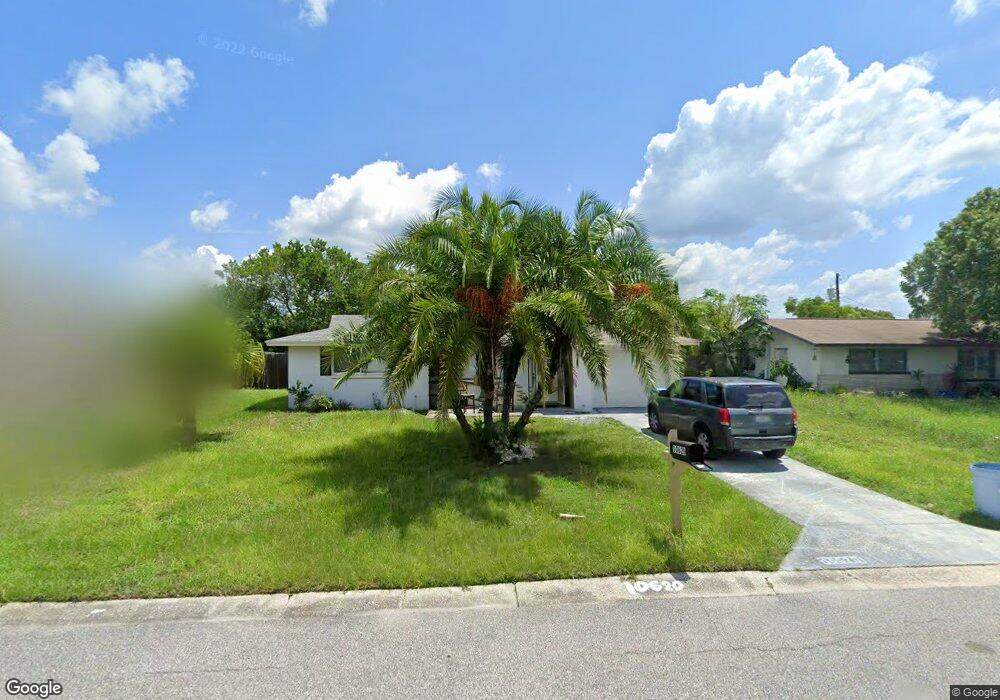
10620 Hibiscus Dr Port Richey, FL 34668
Estimated Value: $189,000 - $216,000
2
Beds
2
Baths
1,376
Sq Ft
$144/Sq Ft
Est. Value
About This Home
This home is located at 10620 Hibiscus Dr, Port Richey, FL 34668 and is currently estimated at $198,267, approximately $144 per square foot. 10620 Hibiscus Dr is a home located in Pasco County with nearby schools including Schrader Elementary School, Bayonet Point Middle School, and Fivay High School.
Ownership History
Date
Name
Owned For
Owner Type
Purchase Details
Closed on
Sep 27, 2017
Sold by
Jr 55 Investments Llc
Bought by
10620 Hibiscus Dr Llc
Current Estimated Value
Purchase Details
Closed on
Aug 1, 2016
Bought by
10620 Hibiscus Dr Llc
Purchase Details
Closed on
Jul 1, 2016
Bought by
10620 Hibiscus Dr Llc
Purchase Details
Closed on
Jul 28, 2010
Sold by
Villasenor Diana and Tuemmler Cindy
Bought by
Christiano Frank J
Home Financials for this Owner
Home Financials are based on the most recent Mortgage that was taken out on this home.
Original Mortgage
$42,160
Interest Rate
4.61%
Mortgage Type
New Conventional
Purchase Details
Closed on
Jun 22, 2005
Sold by
Walters Shirley J
Bought by
Villasenor Diana and Tuemmler Cindy
Purchase Details
Closed on
Apr 21, 2004
Sold by
Cardoza Manuel J
Bought by
Walters Shirley J
Create a Home Valuation Report for This Property
The Home Valuation Report is an in-depth analysis detailing your home's value as well as a comparison with similar homes in the area
Home Values in the Area
Average Home Value in this Area
Purchase History
| Date | Buyer | Sale Price | Title Company |
|---|---|---|---|
| 10620 Hibiscus Dr Llc | -- | None Available | |
| 10620 Hibiscus Dr Llc | $61,500 | -- | |
| 10620 Hibiscus Dr Llc | $42,600 | -- | |
| Christiano Frank J | $55,000 | Capstone Title Llc | |
| Villasenor Diana | -- | -- | |
| Walters Shirley J | -- | -- |
Source: Public Records
Mortgage History
| Date | Status | Borrower | Loan Amount |
|---|---|---|---|
| Previous Owner | Christiano Frank J | $42,160 |
Source: Public Records
Tax History Compared to Growth
Tax History
| Year | Tax Paid | Tax Assessment Tax Assessment Total Assessment is a certain percentage of the fair market value that is determined by local assessors to be the total taxable value of land and additions on the property. | Land | Improvement |
|---|---|---|---|---|
| 2025 | $2,156 | $134,191 | $39,953 | $94,238 |
| 2024 | $2,156 | $139,468 | $39,953 | $99,515 |
| 2023 | $2,024 | $89,580 | $0 | $0 |
| 2022 | $1,657 | $111,388 | $22,903 | $88,485 |
| 2021 | $1,425 | $80,579 | $20,376 | $60,203 |
| 2020 | $1,304 | $72,435 | $13,077 | $59,358 |
| 2019 | $1,202 | $64,954 | $13,077 | $51,877 |
| 2018 | $1,086 | $55,633 | $13,077 | $42,556 |
| 2017 | $926 | $44,836 | $11,702 | $33,134 |
| 2016 | $737 | $36,084 | $8,402 | $27,682 |
| 2015 | $687 | $31,739 | $7,522 | $24,217 |
| 2014 | $239 | $31,134 | $7,522 | $23,612 |
Source: Public Records
Map
Nearby Homes
- 7521 Bougenville Dr
- 7520 Valencia Ave
- 7521 Coventry Dr Unit 1
- 7338 Coventry Dr
- 7535 Lancelot Rd
- 10404 Loquat Dr
- 10800 Leeds Rd
- 7217 Coventry Dr
- 10840 Norwood Ave
- 7735 Canna Dr
- 10443 Raffia Dr
- 10602 Camelia Dr
- 7814 Waxwood Dr
- 10831 Manchester Rd
- 7201 Rhinebeck Dr
- 10336 Oak Hill Dr
- 10517 Camelia Dr
- 10301 Orchid Dr
- 10824 Oldham Rd
- 10211 Oleander Dr
- 10614 Hibiscus Dr
- 10626 Hibiscus Dr
- 10621 Oleander Dr
- 10610 Hibiscus Dr
- 10615 Oleander Dr
- 7504 Bougenville Dr
- 7423 Star Dust Dr
- 7422 Bougenville Dr
- 10611 Oleander Dr
- 10636 Hibiscus Dr
- 10604 Hibiscus Dr
- 7417 Star Dust Dr
- 7416 Bougenville Dr
- 10638 Hibiscus Dr
- 10605 Oleander Dr
- 7422 Star Dust Dr
- 7505 Bougenville Dr
- 7423 Bougenville Dr
- 10540 Hibiscus Dr
- 10616 Oleander Dr