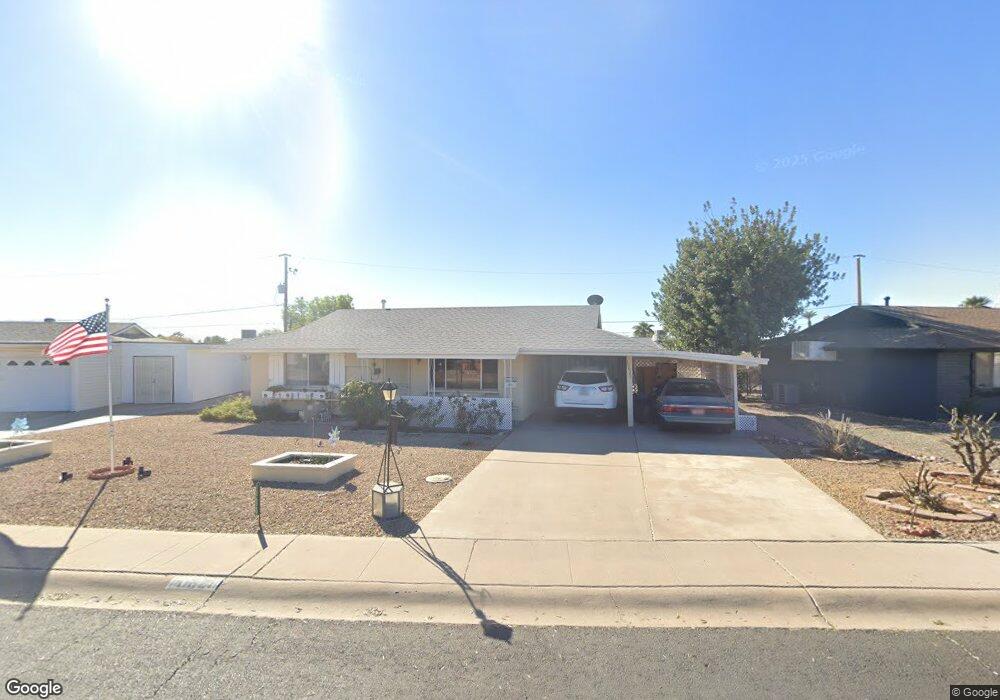
10629 W El Rancho Dr Sun City, AZ 85351
Estimated Value: $191,690 - $210,000
--
Bed
1
Bath
891
Sq Ft
$227/Sq Ft
Est. Value
About This Home
This home is located at 10629 W El Rancho Dr, Sun City, AZ 85351 and is currently estimated at $202,173, approximately $226 per square foot. 10629 W El Rancho Dr is a home located in Maricopa County with nearby schools including Desert Mirage Elementary School, Ombudsman - Northwest Charter, and Peoria Accelerated High School.
Ownership History
Date
Name
Owned For
Owner Type
Purchase Details
Closed on
Nov 2, 2010
Sold by
Huling Dennis E and Dena E Huling Testamentary Tru
Bought by
Huling Dennis E and Huling Cynthia J
Current Estimated Value
Home Financials for this Owner
Home Financials are based on the most recent Mortgage that was taken out on this home.
Original Mortgage
$43,456
Outstanding Balance
$30,413
Interest Rate
5.5%
Mortgage Type
FHA
Estimated Equity
$171,760
Purchase Details
Closed on
Jul 13, 2000
Sold by
Schmidt Delmore L and The Delmore L Schmidt Trust
Bought by
Huling Dean E
Purchase Details
Closed on
Mar 31, 1997
Sold by
Johnson Lloyd R and Johnson Shirley M
Bought by
Schmidt Delmore L
Purchase Details
Closed on
Mar 13, 1997
Sold by
Schmidt Delmore L
Bought by
Schmidt Delmore L and The Delmore L Schmidt Trust
Purchase Details
Closed on
Mar 14, 1994
Sold by
Bittle Randall M and Bittle Mary Louise
Bought by
Johnson Lloyd R and Johnson Shirley M
Create a Home Valuation Report for This Property
The Home Valuation Report is an in-depth analysis detailing your home's value as well as a comparison with similar homes in the area
Home Values in the Area
Average Home Value in this Area
Purchase History
| Date | Buyer | Sale Price | Title Company |
|---|---|---|---|
| Huling Dennis E | -- | Security Title Agency | |
| Huling Dean E | $62,000 | Capital Title Agency | |
| Schmidt Delmore L | $62,000 | North American Title Agency | |
| Schmidt Delmore L | -- | North American Title Agency | |
| Johnson Lloyd R | $47,000 | Security Title Agency |
Source: Public Records
Mortgage History
| Date | Status | Borrower | Loan Amount |
|---|---|---|---|
| Open | Huling Dennis E | $43,456 |
Source: Public Records
Tax History Compared to Growth
Tax History
| Year | Tax Paid | Tax Assessment Tax Assessment Total Assessment is a certain percentage of the fair market value that is determined by local assessors to be the total taxable value of land and additions on the property. | Land | Improvement |
|---|---|---|---|---|
| 2025 | $646 | $7,662 | -- | -- |
| 2024 | $585 | $7,298 | -- | -- |
| 2023 | $585 | $16,030 | $3,200 | $12,830 |
| 2022 | $545 | $12,330 | $2,460 | $9,870 |
| 2021 | $562 | $11,410 | $2,280 | $9,130 |
| 2020 | $548 | $9,920 | $1,980 | $7,940 |
| 2019 | $550 | $8,900 | $1,780 | $7,120 |
| 2018 | $531 | $7,780 | $1,550 | $6,230 |
| 2017 | $514 | $6,630 | $1,320 | $5,310 |
| 2016 | $255 | $6,030 | $1,200 | $4,830 |
| 2015 | $453 | $5,270 | $1,050 | $4,220 |
Source: Public Records
Map
Nearby Homes
- 11427 N 107th Ave
- 10728 W El Rancho Dr
- 11622 N Desert Hills Dr W
- 10530 W Desert Hills Ct
- 10702 W Cherry Hills Dr W
- 10516 W Snead Dr
- 10509 W Snead Dr
- 10848 W Crosby Dr
- 10423 W Monterosa Dr
- 10414 W Sun City Blvd Unit 1
- 10815 W Crosby Dr
- 10419 W Snead Dr
- 11220 N 109th Ave
- 10939 W Sun City Blvd
- 12021 N Riviera Ct
- 11007 W Florida Ave
- 10851 N Fairway Ct W
- 12035 N Cherry Hills Dr E
- 10810 N Fairway Ct W
- 10829 N Fairway Ct W Unit 106
- 10635 W El Rancho Dr Unit 1
- 10626 W Sun City Blvd
- 10632 W Sun City Blvd
- 10641 W El Rancho Dr
- 10622 W Sun City Blvd
- 10619 W El Rancho Dr
- 10628 W El Rancho Dr
- 10634 W El Rancho Dr
- 10638 W Sun City Blvd
- 10618 W El Rancho Dr
- 10640 W El Rancho Dr
- 10616 W Sun City Blvd Unit 1
- 10647 W El Rancho Dr
- 10613 W El Rancho Dr
- 10644 W Sun City Blvd
- 11421 N 107th Ave Unit 1
- 10608 W El Rancho Dr
- 10608 W Sun City Blvd
- 10626 W Connecticut Ave
- 10628 W Connecticut Ave