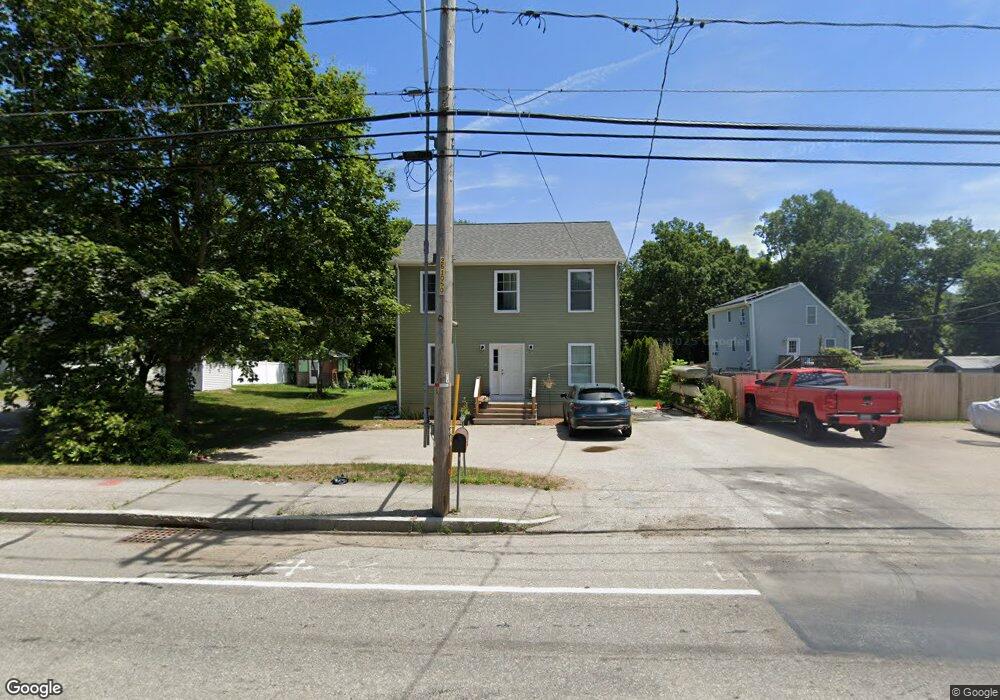
1067 Monponsett St Hanson, MA 02341
Estimated Value: $462,890 - $545,000
4
Beds
2
Baths
1,680
Sq Ft
$302/Sq Ft
Est. Value
About This Home
This home is located at 1067 Monponsett St, Hanson, MA 02341 and is currently estimated at $507,973, approximately $302 per square foot. 1067 Monponsett St is a home located in Plymouth County.
Ownership History
Date
Name
Owned For
Owner Type
Purchase Details
Closed on
Jun 24, 2022
Sold by
Browne Warren S and Browne Eric E
Bought by
Browne Warren S and Browne James
Current Estimated Value
Home Financials for this Owner
Home Financials are based on the most recent Mortgage that was taken out on this home.
Original Mortgage
$389,000
Outstanding Balance
$370,778
Interest Rate
5.25%
Mortgage Type
New Conventional
Estimated Equity
$137,195
Create a Home Valuation Report for This Property
The Home Valuation Report is an in-depth analysis detailing your home's value as well as a comparison with similar homes in the area
Home Values in the Area
Average Home Value in this Area
Purchase History
| Date | Buyer | Sale Price | Title Company |
|---|---|---|---|
| Browne Warren S | -- | None Available | |
| Browne Warren S | -- | None Available |
Source: Public Records
Mortgage History
| Date | Status | Borrower | Loan Amount |
|---|---|---|---|
| Open | Browne Warren S | $389,000 | |
| Closed | Browne Warren S | $389,000 |
Source: Public Records
Tax History Compared to Growth
Tax History
| Year | Tax Paid | Tax Assessment Tax Assessment Total Assessment is a certain percentage of the fair market value that is determined by local assessors to be the total taxable value of land and additions on the property. | Land | Improvement |
|---|---|---|---|---|
| 2025 | $3,526 | $263,500 | $63,600 | $199,900 |
| 2024 | $1,100 | $82,200 | $61,800 | $20,400 |
| 2023 | $2,279 | $160,700 | $61,800 | $98,900 |
| 2022 | $1,109 | $73,500 | $56,100 | $17,400 |
| 2021 | $1,096 | $72,600 | $54,000 | $18,600 |
| 2020 | $1,098 | $71,900 | $52,100 | $19,800 |
| 2019 | $1,013 | $65,200 | $45,500 | $19,700 |
| 2018 | $1,016 | $64,200 | $43,700 | $20,500 |
| 2017 | $1,000 | $62,600 | $41,600 | $21,000 |
| 2016 | $1,046 | $63,200 | $41,600 | $21,600 |
| 2015 | $1,014 | $63,700 | $41,600 | $22,100 |
Source: Public Records
Map
Nearby Homes