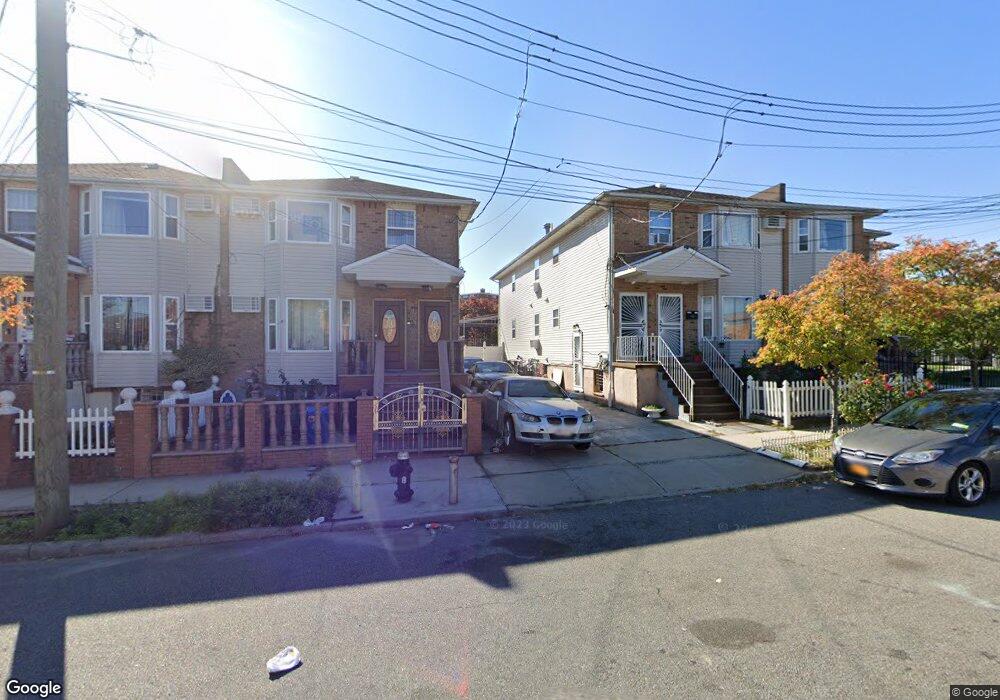
10674 Ruscoe St Jamaica, NY 11433
Jamaica NeighborhoodEstimated Value: $925,000 - $1,250,000
3
Beds
2
Baths
2,220
Sq Ft
$484/Sq Ft
Est. Value
About This Home
This home is located at 10674 Ruscoe St, Jamaica, NY 11433 and is currently estimated at $1,075,063, approximately $484 per square foot. 10674 Ruscoe St is a home located in Queens County with nearby schools including P.S./I.S. 116 William C Hughley and I.S. 238 Susan B Anthony Academy.
Ownership History
Date
Name
Owned For
Owner Type
Purchase Details
Closed on
Jun 15, 2012
Sold by
Ramasar Churan
Bought by
Ramasar Kamla and Ramasar Churan
Current Estimated Value
Home Financials for this Owner
Home Financials are based on the most recent Mortgage that was taken out on this home.
Original Mortgage
$7,273
Outstanding Balance
$5,029
Interest Rate
3.78%
Mortgage Type
New Conventional
Estimated Equity
$1,070,034
Purchase Details
Closed on
Nov 30, 2009
Sold by
Allen Yvonne and Hall Charlotte
Bought by
Ramasar Churan
Home Financials for this Owner
Home Financials are based on the most recent Mortgage that was taken out on this home.
Original Mortgage
$421,245
Interest Rate
5.02%
Mortgage Type
Purchase Money Mortgage
Purchase Details
Closed on
Jun 25, 2008
Sold by
Deutsche Bank National Trust Company
Bought by
Allen Yvonne and Hall Charlotte
Purchase Details
Closed on
Mar 23, 2007
Sold by
Gill Elizabeth Referee
Bought by
Deutsche Bank National Trust Company
Create a Home Valuation Report for This Property
The Home Valuation Report is an in-depth analysis detailing your home's value as well as a comparison with similar homes in the area
Home Values in the Area
Average Home Value in this Area
Purchase History
| Date | Buyer | Sale Price | Title Company |
|---|---|---|---|
| Ramasar Kamla | -- | -- | |
| Ramasar Churan | $460,000 | -- | |
| Allen Yvonne | $404,586 | -- | |
| Deutsche Bank National Trust Company | $1,000 | -- |
Source: Public Records
Mortgage History
| Date | Status | Borrower | Loan Amount |
|---|---|---|---|
| Open | Ramasar Kamla | $7,273 | |
| Previous Owner | Ramasar Churan | $421,245 |
Source: Public Records
Tax History Compared to Growth
Tax History
| Year | Tax Paid | Tax Assessment Tax Assessment Total Assessment is a certain percentage of the fair market value that is determined by local assessors to be the total taxable value of land and additions on the property. | Land | Improvement |
|---|---|---|---|---|
| 2025 | $6,022 | $29,983 | $8,571 | $21,412 |
| 2024 | $6,022 | $29,983 | $9,062 | $20,921 |
| 2023 | $5,976 | $29,755 | $9,138 | $20,617 |
| 2022 | $5,604 | $50,400 | $17,100 | $33,300 |
| 2021 | $5,574 | $43,140 | $17,100 | $26,040 |
| 2020 | $5,289 | $43,620 | $17,100 | $26,520 |
| 2019 | $5,227 | $38,880 | $17,100 | $21,780 |
| 2018 | $5,055 | $24,796 | $9,897 | $14,899 |
| 2017 | $4,769 | $23,394 | $11,020 | $12,374 |
| 2016 | $4,412 | $23,394 | $11,020 | $12,374 |
| 2015 | $2,354 | $20,822 | $11,703 | $9,119 |
| 2014 | $2,354 | $20,822 | $12,269 | $8,553 |
Source: Public Records
Map
Nearby Homes
- 177-33 106th Rd
- 17702 106th Rd
- 177-18 106th Ave
- 106-03 177th St
- 10779 Watson Place
- 177-53 105th Ave
- 104-07 177th St
- 173-61 105th Ave
- 10331 177th St
- 10912 176th St
- 10828 174th St
- 108-32 174th St
- 173-15 109th Ave
- 10944 177th St
- 109-49 176th St
- 172-09 108th Ave
- 10519 171st Place
- 183-09 Dunlop Ave
- 110-01 175th St
- 10513 171st St
- 10674 Ruscoe St
- 107-12 178th St
- 10712 178th St
- 106-70 Ruscoe St Unit 2nd Fl
- 10670 Ruscoe St
- 10714 178th St
- 10668 Ruscoe St
- 10716 178th St
- 10666 Ruscoe St
- 107-79 Watson Place
- 10775 Watson Place
- 10664 Ruscoe St
- 10771 Watson Place
- 10662 Ruscoe St
- 106-62 Ruscoe St
- 10767 Watson Place
- 106-61 Ruscoe St
- 106-61 Ruscoe St Unit 2nd Fl
- 177-38 Ruscoe St
- 17818 107th Ave