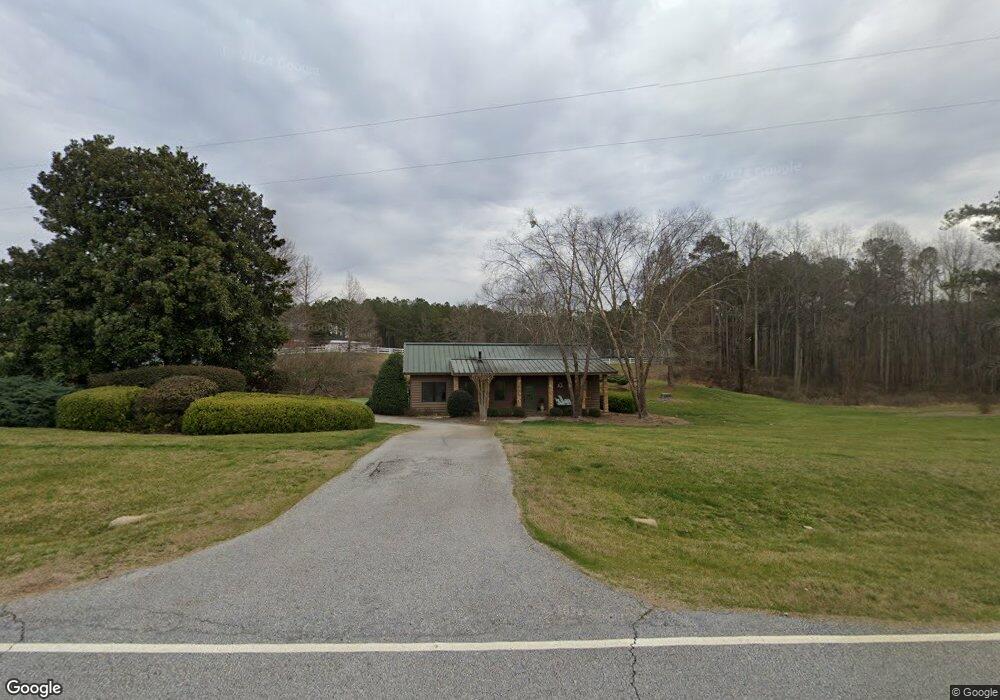
1068 Bay Springs Rd Villa Rica, GA 30180
Abilene NeighborhoodEstimated Value: $232,000 - $260,000
1
Bed
2
Baths
1,176
Sq Ft
$207/Sq Ft
Est. Value
About This Home
This home is located at 1068 Bay Springs Rd, Villa Rica, GA 30180 and is currently estimated at $243,339, approximately $206 per square foot. 1068 Bay Springs Rd is a home located in Carroll County with nearby schools including Ithica Elementary School, Bay Springs Middle School, and Villa Rica High School.
Ownership History
Date
Name
Owned For
Owner Type
Purchase Details
Closed on
Sep 5, 2003
Sold by
Curtis David B
Bought by
Curtis David B
Current Estimated Value
Purchase Details
Closed on
Mar 7, 2002
Sold by
Curtis David B
Bought by
Curtis David B
Purchase Details
Closed on
Sep 6, 1996
Sold by
Southern Craftmen
Bought by
Curtis David B
Purchase Details
Closed on
Sep 5, 1996
Sold by
Jackson Bobby and M J
Bought by
Southern Craftmen
Purchase Details
Closed on
Nov 17, 1977
Bought by
Jackson Bobby and M J
Create a Home Valuation Report for This Property
The Home Valuation Report is an in-depth analysis detailing your home's value as well as a comparison with similar homes in the area
Home Values in the Area
Average Home Value in this Area
Purchase History
| Date | Buyer | Sale Price | Title Company |
|---|---|---|---|
| Curtis David B | -- | -- | |
| Curtis David B | -- | -- | |
| Curtis David B | $80,000 | -- | |
| Southern Craftmen | $80,000 | -- | |
| Jackson Bobby | -- | -- |
Source: Public Records
Tax History Compared to Growth
Tax History
| Year | Tax Paid | Tax Assessment Tax Assessment Total Assessment is a certain percentage of the fair market value that is determined by local assessors to be the total taxable value of land and additions on the property. | Land | Improvement |
|---|---|---|---|---|
| 2024 | $1,674 | $73,979 | $5,595 | $68,384 |
| 2023 | $1,674 | $73,979 | $5,595 | $68,384 |
| 2022 | $1,470 | $58,604 | $3,730 | $54,874 |
| 2021 | $1,300 | $50,722 | $2,984 | $47,738 |
| 2020 | $1,136 | $44,252 | $2,713 | $41,539 |
| 2019 | $1,061 | $41,007 | $2,713 | $38,294 |
| 2018 | $954 | $36,334 | $2,535 | $33,799 |
| 2017 | $1,038 | $39,406 | $2,535 | $36,871 |
| 2016 | $963 | $36,556 | $2,535 | $34,021 |
| 2015 | $896 | $32,049 | $2,727 | $29,322 |
| 2014 | $900 | $32,050 | $2,727 | $29,322 |
Source: Public Records
Map
Nearby Homes