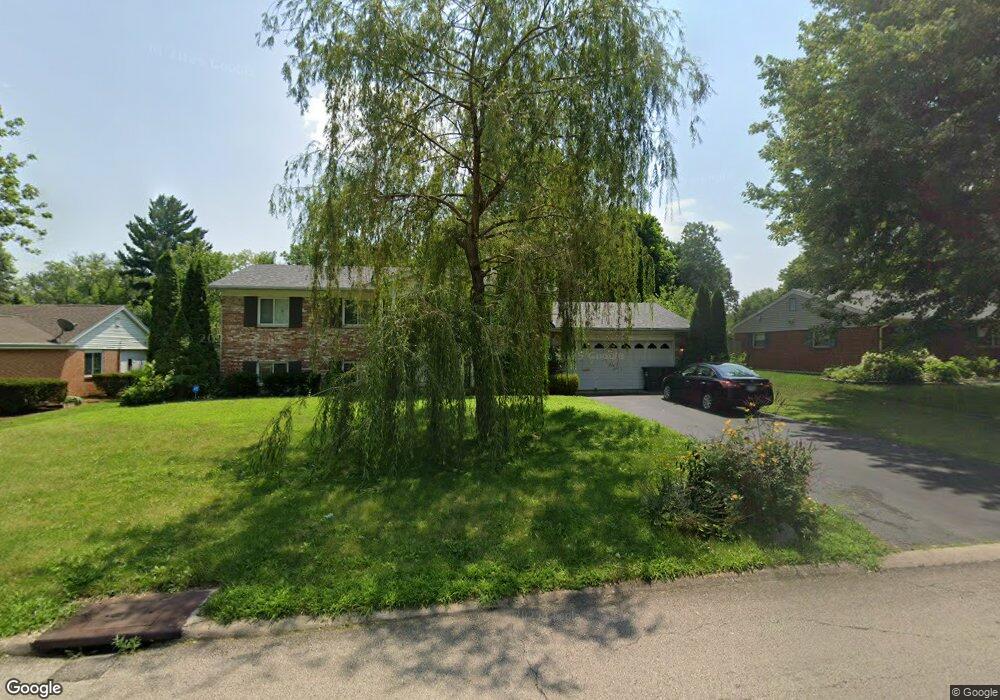
1068 Pepper Hill Dr Dayton, OH 45429
Estimated Value: $325,000 - $354,000
4
Beds
2
Baths
2,310
Sq Ft
$146/Sq Ft
Est. Value
About This Home
This home is located at 1068 Pepper Hill Dr, Dayton, OH 45429 and is currently estimated at $336,281, approximately $145 per square foot. 1068 Pepper Hill Dr is a home located in Montgomery County with nearby schools including John F. Kennedy Elementary School, Kettering Middle School, and Kettering Fairmont High School.
Ownership History
Date
Name
Owned For
Owner Type
Purchase Details
Closed on
Jul 29, 2022
Sold by
Weeks Elizabeth L and Weeks William D
Bought by
Goutermont Dillon R
Current Estimated Value
Home Financials for this Owner
Home Financials are based on the most recent Mortgage that was taken out on this home.
Original Mortgage
$299,000
Outstanding Balance
$285,859
Interest Rate
5.51%
Mortgage Type
New Conventional
Estimated Equity
$50,422
Purchase Details
Closed on
Jul 16, 2010
Sold by
Weeks Elizabeth L
Bought by
Weeks Elizabeth L and Weeks William D
Purchase Details
Closed on
Feb 18, 2010
Sold by
Gray Susan H and Gray Frank M
Bought by
Weeks Elizabeth L
Purchase Details
Closed on
Dec 29, 2009
Sold by
Estate Of Frank Mckinley Gray
Bought by
Weeks Elizabeth L and Gray Susan H
Purchase Details
Closed on
Apr 16, 2003
Sold by
Estate Of Jane Walker Gray
Bought by
Gray Frank M and Gray Frank Mck
Create a Home Valuation Report for This Property
The Home Valuation Report is an in-depth analysis detailing your home's value as well as a comparison with similar homes in the area
Home Values in the Area
Average Home Value in this Area
Purchase History
| Date | Buyer | Sale Price | Title Company |
|---|---|---|---|
| Goutermont Dillon R | $304,000 | Vantage Land Title | |
| Weeks Elizabeth L | -- | Attorney | |
| Weeks Elizabeth L | $102,000 | Attorney | |
| Weeks Elizabeth L | -- | Attorney | |
| Gray Frank M | -- | -- |
Source: Public Records
Mortgage History
| Date | Status | Borrower | Loan Amount |
|---|---|---|---|
| Open | Goutermont Dillon R | $299,000 |
Source: Public Records
Tax History Compared to Growth
Tax History
| Year | Tax Paid | Tax Assessment Tax Assessment Total Assessment is a certain percentage of the fair market value that is determined by local assessors to be the total taxable value of land and additions on the property. | Land | Improvement |
|---|---|---|---|---|
| 2024 | $5,407 | $87,280 | $12,130 | $75,150 |
| 2023 | $5,407 | $87,280 | $12,130 | $75,150 |
| 2022 | $5,193 | $66,300 | $9,190 | $57,110 |
| 2021 | $4,802 | $66,300 | $9,190 | $57,110 |
| 2020 | $4,817 | $66,300 | $9,190 | $57,110 |
| 2019 | $3,916 | $47,610 | $9,190 | $38,420 |
| 2018 | $3,937 | $47,610 | $9,190 | $38,420 |
| 2017 | $3,626 | $47,610 | $9,190 | $38,420 |
| 2016 | $3,649 | $45,030 | $9,190 | $35,840 |
| 2015 | $3,485 | $45,030 | $9,190 | $35,840 |
| 2014 | $3,485 | $45,030 | $9,190 | $35,840 |
| 2012 | -- | $50,510 | $10,210 | $40,300 |
Source: Public Records
Map
Nearby Homes
- 1049 Georgian Dr
- 4817 Ackerman Blvd
- 4640 Marshall Rd
- 1310 Partridge Run Cir Unit 1310
- 5017 Ackerman Blvd
- 1033 Carlo Dr
- 1008 Rio Ln
- 5155 Marshall Rd
- 730 Hyde Park Dr
- 4541 Acreview Ln
- 617 Laurelann Dr
- 321 Princewood Ave
- 804 Lovetta Dr
- 501 Judith Dr
- 1328 Willowdale Ave
- 791 Willowdale Ave
- 4307 Meadowcroft Rd
- 1013 Swango Dr
- 4244 Flowerdale Ave
- 4816 Judith Dr
- 1060 Pepper Hill Dr
- 1076 Pepper Hill Dr
- 1039 Independence Dr
- 1047 Independence Dr
- 1052 Pepper Hill Dr
- 1059 Pepper Hill Dr
- 1084 Pepper Hill Dr
- 1031 Independence Dr
- 1075 Pepper Hill Dr
- 1055 Independence Dr
- 1023 Independence Dr
- 4725 Renwood Dr
- 1044 Pepper Hill Dr
- 1092 Pepper Hill Dr
- 4724 Renwood Dr
- 1063 Independence Dr
- 1051 Pepper Hill Dr
- 1091 Pepper Hill Dr
- 1040 Independence Dr
- 4724 Highgate Dr