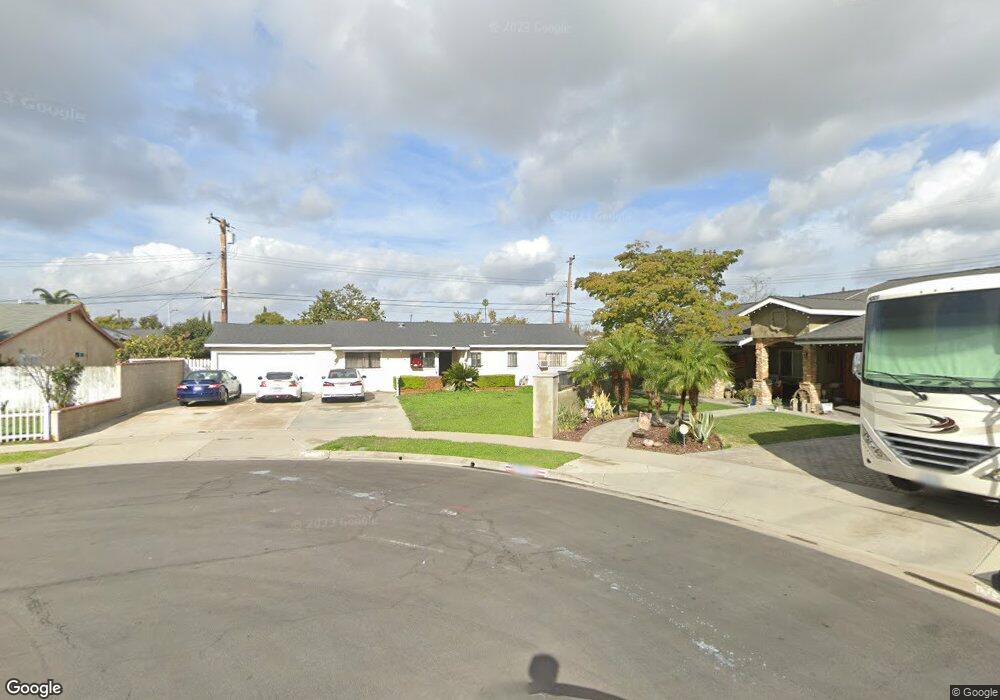
10691 Silver Cir Garden Grove, CA 92843
Little Saigon NeighborhoodEstimated Value: $905,784 - $1,086,000
3
Beds
3
Baths
1,174
Sq Ft
$836/Sq Ft
Est. Value
About This Home
This home is located at 10691 Silver Cir, Garden Grove, CA 92843 and is currently estimated at $981,946, approximately $836 per square foot. 10691 Silver Cir is a home located in Orange County with nearby schools including Post Elementary, James Irvine Intermediate School, and La Quinta High School.
Ownership History
Date
Name
Owned For
Owner Type
Purchase Details
Closed on
May 15, 1998
Sold by
Hoang Nam Trong and Nguyen Nghiep Thi
Bought by
Hoang Nam Trong
Current Estimated Value
Purchase Details
Closed on
Dec 22, 1997
Sold by
Van Tu Tran
Bought by
Hoang Nam Trong and Nguyen Nghiep Thi
Home Financials for this Owner
Home Financials are based on the most recent Mortgage that was taken out on this home.
Original Mortgage
$131,200
Interest Rate
6.98%
Purchase Details
Closed on
Oct 25, 1996
Sold by
Thu Tu Anh
Bought by
Vantu Tran
Purchase Details
Closed on
Mar 25, 1995
Sold by
Chhay Horn Leang and Seung Sok Lang
Bought by
Vanvantu Tran Van and Tu Anh Thu
Home Financials for this Owner
Home Financials are based on the most recent Mortgage that was taken out on this home.
Original Mortgage
$116,400
Interest Rate
8.46%
Create a Home Valuation Report for This Property
The Home Valuation Report is an in-depth analysis detailing your home's value as well as a comparison with similar homes in the area
Home Values in the Area
Average Home Value in this Area
Purchase History
| Date | Buyer | Sale Price | Title Company |
|---|---|---|---|
| Hoang Nam Trong | -- | Orange Coast Title Companies | |
| Hoang Nam Trong | $164,000 | Fidelity National Title Ins | |
| Vantu Tran | -- | -- | |
| Vanvantu Tran Van | $145,000 | Southland Title Corporation |
Source: Public Records
Mortgage History
| Date | Status | Borrower | Loan Amount |
|---|---|---|---|
| Previous Owner | Hoang Nam Trong | $131,200 | |
| Previous Owner | Vanvantu Tran Van | $116,400 |
Source: Public Records
Tax History Compared to Growth
Tax History
| Year | Tax Paid | Tax Assessment Tax Assessment Total Assessment is a certain percentage of the fair market value that is determined by local assessors to be the total taxable value of land and additions on the property. | Land | Improvement |
|---|---|---|---|---|
| 2025 | $3,455 | $261,854 | $183,820 | $78,034 |
| 2024 | $3,455 | $256,720 | $180,216 | $76,504 |
| 2023 | $3,389 | $251,687 | $176,683 | $75,004 |
| 2022 | $3,316 | $246,752 | $173,218 | $73,534 |
| 2021 | $3,281 | $241,914 | $169,821 | $72,093 |
| 2020 | $3,238 | $239,434 | $168,080 | $71,354 |
| 2019 | $3,180 | $234,740 | $164,785 | $69,955 |
| 2018 | $3,118 | $230,138 | $161,554 | $68,584 |
| 2017 | $3,076 | $225,626 | $158,386 | $67,240 |
| 2016 | $2,931 | $221,202 | $155,280 | $65,922 |
| 2015 | $2,890 | $217,880 | $152,948 | $64,932 |
| 2014 | $2,822 | $213,613 | $149,952 | $63,661 |
Source: Public Records
Map
Nearby Homes
- 5405 W 4th St
- 5317 Silver Dr
- 10886 Lotus Dr
- 812 N Euclid St
- 14356 Taft St
- 10632 Henderson Ave
- 323 N Euclid St Unit 99
- 13322 Euclid St
- 14376 Euclid St Unit 1-4
- 5132 W 1st St Unit B
- 4832 W 5th St Unit B
- 5112 W 1st St Unit C
- 5114 W 1st St Unit C
- 14151 Lake St
- 10581 Davit Ave
- 10562 Davit Ave
- 9936 Pear Dr
- 14171 Flower St
- 615 S Euclid St
- 9884 11th St
- 10701 Silver Cir
- 10692 Amber Cir
- 10681 Silver Cir
- 10682 Amber Cir
- 10702 Amber Cir
- 10661 Silver Cir
- 10702 Silver Cir
- 10662 Amber Cir
- 5521 Silver Dr
- 14671 Taft St
- 5522 Silver Dr
- 10692 Silver Cir
- 10682 Silver Cir
- 5526 Silver Dr
- 14692 Sail St
- 14661 Taft St
- 10662 Silver Cir
- 10701 Amber Cir
- 14672 Sail St
- 14681 Taft St