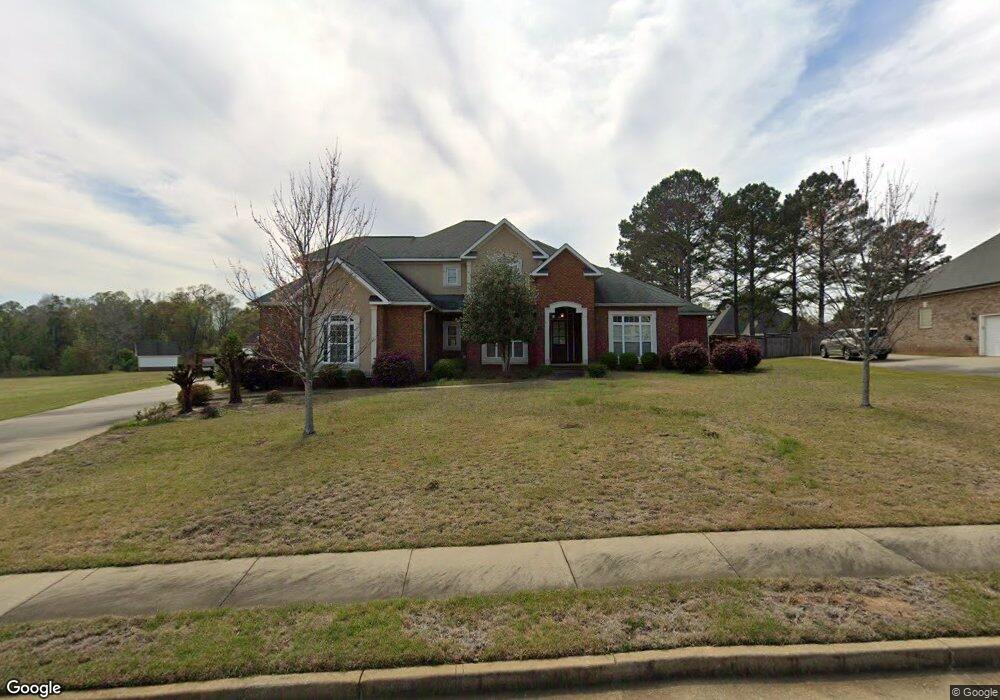
107 Erin Lee Ct Warner Robins, GA 31088
Estimated Value: $442,000 - $651,000
--
Bed
1
Bath
4,046
Sq Ft
$140/Sq Ft
Est. Value
About This Home
This home is located at 107 Erin Lee Ct, Warner Robins, GA 31088 and is currently estimated at $567,275, approximately $140 per square foot. 107 Erin Lee Ct is a home located in Houston County with nearby schools including Lake Joy Primary School, Lake Joy Elementary School, and Feagin Mill Middle School.
Ownership History
Date
Name
Owned For
Owner Type
Purchase Details
Closed on
Feb 28, 2014
Sold by
Stanley Gregory Howard
Bought by
Stanley Gregory H and Ruemker Krystal D
Current Estimated Value
Purchase Details
Closed on
Mar 25, 2008
Sold by
Trinity Built Homes
Bought by
Stanley Gregory H and Ruemker Krystal D
Home Financials for this Owner
Home Financials are based on the most recent Mortgage that was taken out on this home.
Original Mortgage
$334,400
Interest Rate
5.68%
Mortgage Type
Purchase Money Mortgage
Purchase Details
Closed on
Oct 26, 2006
Sold by
Trinity Built Homes By Lod
Bought by
Trinity Built Homes Llc
Purchase Details
Closed on
Nov 17, 2005
Sold by
Cierra Developers Llc
Bought by
Trinity Built Homes By Lod Llc
Purchase Details
Closed on
Oct 18, 2005
Sold by
Tharpes Mill Llc
Bought by
Cierra Developers Llc
Create a Home Valuation Report for This Property
The Home Valuation Report is an in-depth analysis detailing your home's value as well as a comparison with similar homes in the area
Home Values in the Area
Average Home Value in this Area
Purchase History
| Date | Buyer | Sale Price | Title Company |
|---|---|---|---|
| Stanley Gregory H | -- | -- | |
| Stanley Gregory H | $418,000 | None Available | |
| Trinity Built Homes Llc | -- | -- | |
| Trinity Built Homes By Lod Llc | $64,000 | -- | |
| Cierra Developers Llc | $47,500 | -- |
Source: Public Records
Mortgage History
| Date | Status | Borrower | Loan Amount |
|---|---|---|---|
| Previous Owner | Stanley Gregory H | $334,400 |
Source: Public Records
Tax History Compared to Growth
Tax History
| Year | Tax Paid | Tax Assessment Tax Assessment Total Assessment is a certain percentage of the fair market value that is determined by local assessors to be the total taxable value of land and additions on the property. | Land | Improvement |
|---|---|---|---|---|
| 2024 | $6,723 | $214,160 | $14,400 | $199,760 |
| 2023 | $5,811 | $184,880 | $14,400 | $170,480 |
| 2022 | $3,620 | $159,440 | $14,400 | $145,040 |
| 2021 | $3,244 | $142,320 | $14,400 | $127,920 |
| 2020 | $3,104 | $135,600 | $14,400 | $121,200 |
| 2019 | $3,104 | $135,600 | $14,400 | $121,200 |
| 2018 | $3,104 | $135,600 | $14,400 | $121,200 |
| 2017 | $3,107 | $135,600 | $14,400 | $121,200 |
| 2016 | $3,158 | $135,600 | $14,400 | $121,200 |
| 2015 | -- | $135,600 | $14,400 | $121,200 |
| 2014 | -- | $135,600 | $14,400 | $121,200 |
| 2013 | -- | $152,080 | $14,400 | $137,680 |
Source: Public Records
Map
Nearby Homes
- 105 Erin Lee Ct
- 104 Dalton Ct
- 0 Dalton Ct Unit 7305074
- 106 Dalton Ct
- 102 Dalton Ct
- 103 Erin Lee Ct
- 111 Erin Lee Ct
- 111 Erin Lee Ct Unit 38
- 109 Erin Lee Ct
- 0 Erin Lee Ct Unit 8319624
- 0 Erin Lee Ct Unit 9047872
- 108 Erin Lee Ct
- 100 Dalton Ct
- 106 Erin Lee Ct
- 108 Dalton Ct
- 101 Erin Lee Ct
- 104 Erin Lee Ct
- 135 Havelock Cir
- 103 Dalton Ct
- 105 Dalton Ct