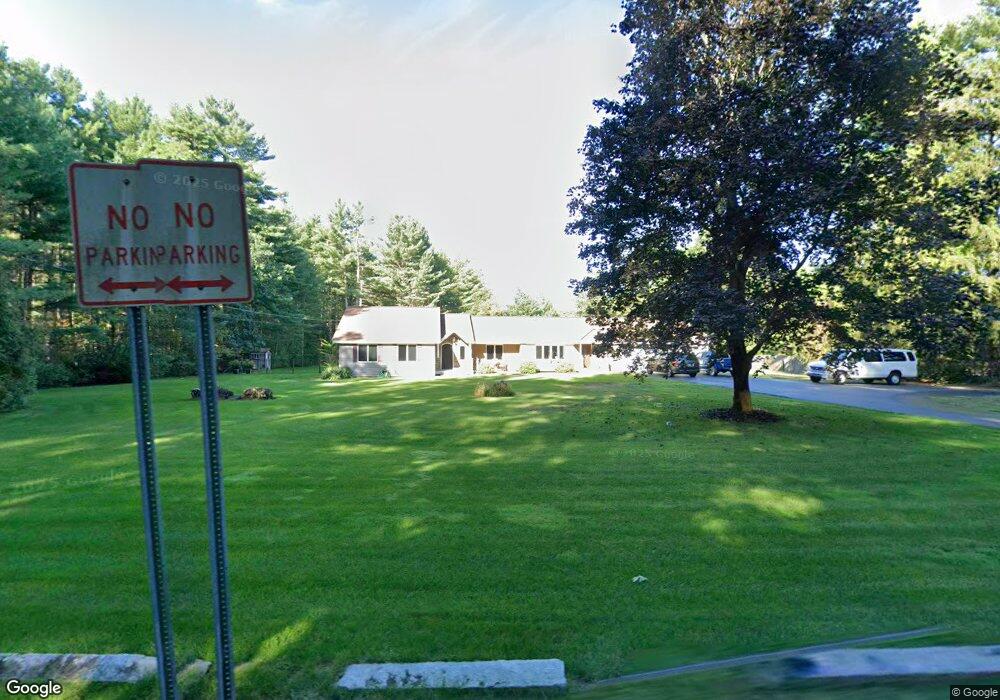
107 Groton Rd Nashua, NH 03062
Southwest Nashua NeighborhoodEstimated Value: $657,000 - $896,000
4
Beds
2
Baths
2,615
Sq Ft
$301/Sq Ft
Est. Value
About This Home
This home is located at 107 Groton Rd, Nashua, NH 03062 and is currently estimated at $787,435, approximately $301 per square foot. 107 Groton Rd is a home located in Hillsborough County with nearby schools including Main Dunstable School, Elm Street Middle School, and Nashua High School South.
Ownership History
Date
Name
Owned For
Owner Type
Purchase Details
Closed on
Sep 18, 2014
Sold by
Witts Gary J
Bought by
Witts Laura
Current Estimated Value
Purchase Details
Closed on
Jun 26, 2000
Sold by
Desantis Richard C and Desantis Miriam J
Bought by
Witts Gary J
Home Financials for this Owner
Home Financials are based on the most recent Mortgage that was taken out on this home.
Original Mortgage
$219,920
Interest Rate
8.48%
Create a Home Valuation Report for This Property
The Home Valuation Report is an in-depth analysis detailing your home's value as well as a comparison with similar homes in the area
Home Values in the Area
Average Home Value in this Area
Purchase History
| Date | Buyer | Sale Price | Title Company |
|---|---|---|---|
| Witts Laura | -- | -- | |
| Witts Gary J | $275,000 | -- |
Source: Public Records
Mortgage History
| Date | Status | Borrower | Loan Amount |
|---|---|---|---|
| Previous Owner | Witts Gary J | $150,000 | |
| Previous Owner | Witts Gary J | $219,920 |
Source: Public Records
Tax History Compared to Growth
Tax History
| Year | Tax Paid | Tax Assessment Tax Assessment Total Assessment is a certain percentage of the fair market value that is determined by local assessors to be the total taxable value of land and additions on the property. | Land | Improvement |
|---|---|---|---|---|
| 2024 | $10,550 | $663,500 | $192,100 | $471,400 |
| 2023 | $10,495 | $575,700 | $153,700 | $422,000 |
| 2022 | $10,403 | $575,700 | $153,700 | $422,000 |
| 2021 | $10,073 | $433,800 | $104,800 | $329,000 |
| 2020 | $9,761 | $431,700 | $104,800 | $326,900 |
| 2019 | $8,850 | $406,700 | $104,800 | $301,900 |
| 2018 | $8,586 | $404,800 | $104,800 | $300,000 |
| 2017 | $7,863 | $304,900 | $85,900 | $219,000 |
| 2016 | $7,644 | $304,900 | $85,900 | $219,000 |
| 2015 | $7,479 | $304,900 | $85,900 | $219,000 |
| 2014 | $7,333 | $304,900 | $85,900 | $219,000 |
Source: Public Records
Map
Nearby Homes