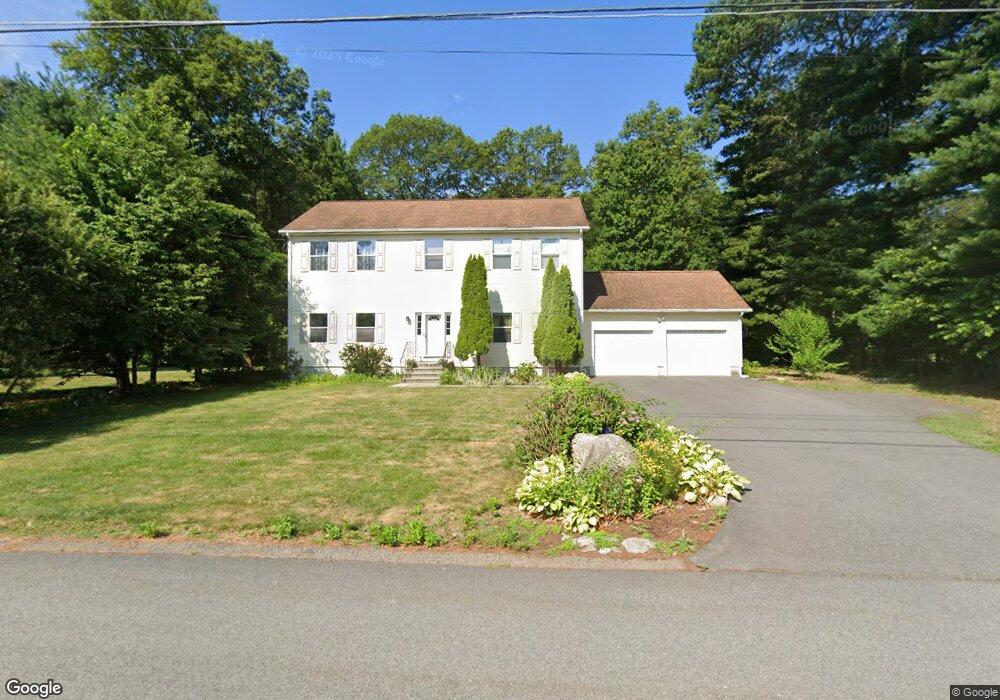
107 S High St Foxboro, MA 02035
Estimated Value: $814,568 - $901,000
4
Beds
3
Baths
2,420
Sq Ft
$355/Sq Ft
Est. Value
About This Home
This home is located at 107 S High St, Foxboro, MA 02035 and is currently estimated at $859,892, approximately $355 per square foot. 107 S High St is a home located in Norfolk County with nearby schools including Foxborough High School, Foxborough Regional Charter School, and Hands-On-Montessori School.
Ownership History
Date
Name
Owned For
Owner Type
Purchase Details
Closed on
Feb 17, 2005
Sold by
Frost Bradley N and Frost Marilyn
Bought by
Tummla Raja S and Edupuganti Sailaja
Current Estimated Value
Home Financials for this Owner
Home Financials are based on the most recent Mortgage that was taken out on this home.
Original Mortgage
$359,650
Outstanding Balance
$183,165
Interest Rate
5.78%
Mortgage Type
Purchase Money Mortgage
Estimated Equity
$676,727
Purchase Details
Closed on
Oct 21, 2003
Sold by
Gordon Inez Est
Bought by
Frost Bradley N and Frost Marilyn
Home Financials for this Owner
Home Financials are based on the most recent Mortgage that was taken out on this home.
Original Mortgage
$169,400
Interest Rate
6.43%
Mortgage Type
Purchase Money Mortgage
Create a Home Valuation Report for This Property
The Home Valuation Report is an in-depth analysis detailing your home's value as well as a comparison with similar homes in the area
Home Values in the Area
Average Home Value in this Area
Purchase History
| Date | Buyer | Sale Price | Title Company |
|---|---|---|---|
| Tummla Raja S | $467,000 | -- | |
| Frost Bradley N | $225,900 | -- |
Source: Public Records
Mortgage History
| Date | Status | Borrower | Loan Amount |
|---|---|---|---|
| Open | Tummla Raja S | $359,650 | |
| Closed | Tummla Raja S | $60,000 | |
| Previous Owner | Frost Bradley N | $169,400 |
Source: Public Records
Tax History Compared to Growth
Tax History
| Year | Tax Paid | Tax Assessment Tax Assessment Total Assessment is a certain percentage of the fair market value that is determined by local assessors to be the total taxable value of land and additions on the property. | Land | Improvement |
|---|---|---|---|---|
| 2025 | $8,818 | $667,000 | $214,700 | $452,300 |
| 2024 | $8,621 | $638,100 | $214,700 | $423,400 |
| 2023 | $8,218 | $578,300 | $204,500 | $373,800 |
| 2022 | $8,022 | $552,500 | $195,500 | $357,000 |
| 2021 | $7,795 | $528,800 | $177,800 | $351,000 |
| 2020 | $7,533 | $517,000 | $177,800 | $339,200 |
| 2019 | $7,128 | $484,900 | $169,400 | $315,500 |
| 2018 | $6,905 | $473,900 | $169,400 | $304,500 |
| 2017 | $6,607 | $439,300 | $158,300 | $281,000 |
| 2016 | $6,462 | $436,000 | $152,100 | $283,900 |
| 2015 | $6,489 | $427,200 | $128,500 | $298,700 |
| 2014 | $6,278 | $418,800 | $126,000 | $292,800 |
Source: Public Records
Map
Nearby Homes
- 356 Central St
- 12 Spring St
- 450 West St
- 166 Chauncy St
- 28 Angell St
- 42 Angell St
- 44 Angell St Unit 44
- 619 N Main St
- 22 Pleasant St Unit C
- 406 South St
- 11 W Belcher Rd Unit 2
- 80 Mill St
- 28 Court St
- 231 Spring St
- 82 Brook St
- 16 East St Unit 2
- 18 Winter St Unit E
- 14 Winter St Unit B
- 84 Cocasset St Unit A6
- 24 Mechanic St