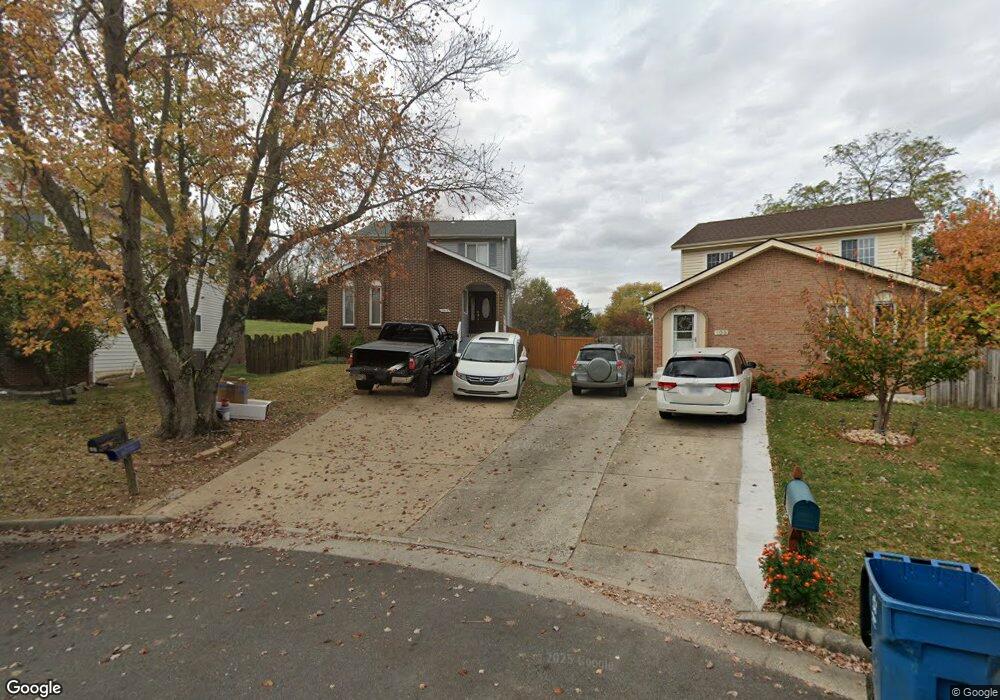
107 Sexton Ct Sterling, VA 20164
Estimated Value: $628,778 - $665,000
4
Beds
3
Baths
1,948
Sq Ft
$335/Sq Ft
Est. Value
About This Home
This home is located at 107 Sexton Ct, Sterling, VA 20164 and is currently estimated at $652,445, approximately $334 per square foot. 107 Sexton Ct is a home located in Loudoun County with nearby schools including Forest Grove Elementary School, Sterling Middle School, and Park View High School.
Ownership History
Date
Name
Owned For
Owner Type
Purchase Details
Closed on
Apr 21, 2003
Sold by
Alvarado Ismael
Bought by
Chegu Balaramaiah S
Current Estimated Value
Home Financials for this Owner
Home Financials are based on the most recent Mortgage that was taken out on this home.
Original Mortgage
$228,000
Outstanding Balance
$97,947
Interest Rate
5.75%
Mortgage Type
New Conventional
Estimated Equity
$554,498
Purchase Details
Closed on
Oct 27, 1997
Sold by
Austin Dennis K and Austin Maria G
Bought by
Alvarado Ismael and Alvarado Maria D
Home Financials for this Owner
Home Financials are based on the most recent Mortgage that was taken out on this home.
Original Mortgage
$144,428
Interest Rate
7.48%
Mortgage Type
FHA
Purchase Details
Closed on
Jan 29, 1996
Sold by
M & B Construction Co Inc
Bought by
Austin Dennis K
Home Financials for this Owner
Home Financials are based on the most recent Mortgage that was taken out on this home.
Original Mortgage
$144,650
Interest Rate
7.13%
Create a Home Valuation Report for This Property
The Home Valuation Report is an in-depth analysis detailing your home's value as well as a comparison with similar homes in the area
Home Values in the Area
Average Home Value in this Area
Purchase History
| Date | Buyer | Sale Price | Title Company |
|---|---|---|---|
| Chegu Balaramaiah S | $285,000 | -- | |
| Alvarado Ismael | $146,000 | -- | |
| Austin Dennis K | $146,500 | -- |
Source: Public Records
Mortgage History
| Date | Status | Borrower | Loan Amount |
|---|---|---|---|
| Open | Austin Dennis K | $228,000 | |
| Previous Owner | Austin Dennis K | $144,428 | |
| Previous Owner | Austin Dennis K | $144,650 |
Source: Public Records
Tax History Compared to Growth
Tax History
| Year | Tax Paid | Tax Assessment Tax Assessment Total Assessment is a certain percentage of the fair market value that is determined by local assessors to be the total taxable value of land and additions on the property. | Land | Improvement |
|---|---|---|---|---|
| 2025 | $4,980 | $618,630 | $231,100 | $387,530 |
| 2024 | $4,835 | $558,980 | $206,100 | $352,880 |
| 2023 | $4,853 | $554,600 | $206,100 | $348,500 |
| 2022 | $4,495 | $505,070 | $186,100 | $318,970 |
| 2021 | $4,414 | $450,360 | $176,100 | $274,260 |
| 2020 | $4,611 | $445,500 | $151,100 | $294,400 |
| 2019 | $4,492 | $429,820 | $151,100 | $278,720 |
| 2018 | $4,307 | $396,920 | $136,100 | $260,820 |
| 2017 | $4,358 | $387,380 | $136,100 | $251,280 |
| 2016 | $4,409 | $385,090 | $0 | $0 |
| 2015 | $4,007 | $235,420 | $0 | $235,420 |
| 2014 | $4,117 | $238,840 | $0 | $238,840 |
Source: Public Records
Map
Nearby Homes
- 409 N Argonne Ave
- 208 Keyes Ct
- 301 N Alder Ave
- 316 Hanford Ct
- 724 N Amelia St
- 224 W Beech Rd
- 221 N Emory Dr Unit 4
- 1300 E Beech Rd
- 814 N Croydon St
- 108 N Alder Ave
- 203 N Lincoln Ave
- 113 N College Dr Unit 175
- 113 N Harrison Rd
- 805 N York Rd
- 104 N Garfield Rd
- 207 N Laura Anne Dr
- 102 N Garfield Rd
- 1307 E Holly Ave
- 1314 E Holly Ave
- 312 E Gordon St
- 105 Sexton Ct
- 109 Sexton Ct
- 111 Sexton Ct
- 103 Sexton Ct
- 110 Sexton Ct
- 421 N Argonne Ave
- 108 Sexton Ct
- 106 Sexton Ct
- 419 N Argonne Ave
- 104 Sexton Ct
- 102 Sexton Ct
- 417 N Argonne Ave
- 100 Sexton Ct
- 420 N Argonne Ave
- 422 N Argonne Ave
- 415 N Argonne Ave
- 418 N Argonne Ave
- 500 N Argonne Ave
- 413 N Argonne Ave
- 416 N Argonne Ave