10710 Kay Berrie Dr Unit 10710 Saint Louis, MO 63123
Estimated Value: $211,000 - $234,000
3
Beds
2
Baths
1,470
Sq Ft
$150/Sq Ft
Est. Value
About This Home
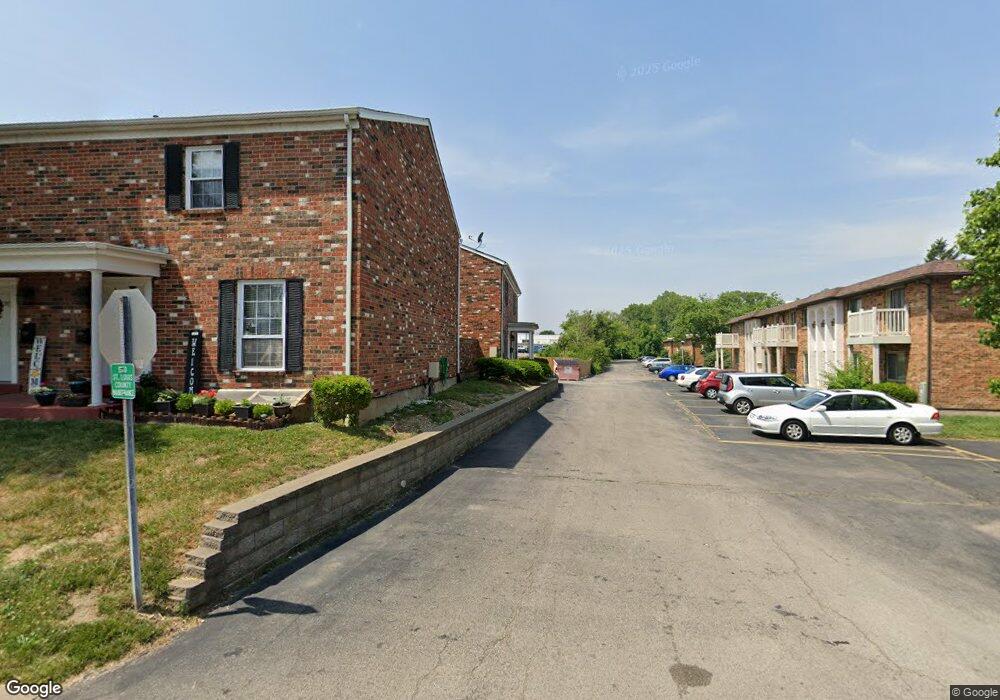
This home is located at 10710 Kay Berrie Dr Unit 10710, Saint Louis, MO 63123 and is currently estimated at $220,545, approximately $150 per square foot. 10710 Kay Berrie Dr Unit 10710 is a home located in St. Louis County with nearby schools including Sappington Elementary School, Sperreng Middle School, and Lindbergh High School.
Ownership History
Date
Name
Owned For
Owner Type
Purchase Details
Closed on
Sep 5, 2002
Sold by
Middlewest Properties Inc
Bought by
Milenko Sokic and Milenko Zorka
Current Estimated Value
Home Financials for this Owner
Home Financials are based on the most recent Mortgage that was taken out on this home.
Original Mortgage
$101,850
Outstanding Balance
$42,577
Interest Rate
6.25%
Estimated Equity
$177,968
Purchase Details
Closed on
Mar 1, 2002
Sold by
Sanders Anthony W and Sanders Sherry L
Bought by
Middlewest Properties Inc
Purchase Details
Closed on
Oct 12, 2000
Sold by
Sanders Anthony W and Sanders Sherry L
Bought by
Anthony Anthony W and Anthony Sherry L
Purchase Details
Closed on
Feb 14, 1997
Sold by
Sanders Anthony W
Bought by
Sanders Anthony W and Sanders Sherry L
Create a Home Valuation Report for This Property
The Home Valuation Report is an in-depth analysis detailing your home's value as well as a comparison with similar homes in the area
Home Values in the Area
Average Home Value in this Area
Purchase History
| Date | Buyer | Sale Price | Title Company |
|---|---|---|---|
| Milenko Sokic | $105,000 | -- | |
| Middlewest Properties Inc | $77,200 | -- | |
| Anthony Anthony W | -- | -- | |
| Sanders Anthony W | -- | -- |
Source: Public Records
Mortgage History
| Date | Status | Borrower | Loan Amount |
|---|---|---|---|
| Open | Milenko Sokic | $101,850 | |
| Closed | Middlewest Properties Inc | -- |
Source: Public Records
Tax History Compared to Growth
Tax History
| Year | Tax Paid | Tax Assessment Tax Assessment Total Assessment is a certain percentage of the fair market value that is determined by local assessors to be the total taxable value of land and additions on the property. | Land | Improvement |
|---|---|---|---|---|
| 2025 | $1,884 | $32,480 | $9,220 | $23,260 |
| 2024 | $1,884 | $28,490 | $5,590 | $22,900 |
| 2023 | $1,879 | $28,490 | $5,590 | $22,900 |
| 2022 | $1,782 | $23,980 | $7,680 | $16,300 |
| 2021 | $1,580 | $23,980 | $7,680 | $16,300 |
| 2020 | $1,498 | $21,910 | $5,590 | $16,320 |
| 2019 | $1,494 | $21,910 | $5,590 | $16,320 |
| 2018 | $1,600 | $21,370 | $3,210 | $18,160 |
| 2017 | $1,583 | $21,370 | $3,210 | $18,160 |
| 2016 | $1,602 | $20,540 | $4,470 | $16,070 |
| 2015 | $1,608 | $20,540 | $4,470 | $16,070 |
| 2014 | -- | $19,320 | $3,760 | $15,560 |
Source: Public Records
Map
Nearby Homes
- 10903 Village Grove Dr Unit D
- 10924 Village Grove Dr Unit C
- 11542 Concord Village Ave
- 11673 Rossmoor Ln
- 10835 Mallory Dr
- 9932 Jan Dr
- 10756 Gail Ct
- 10115 Fite Cir
- 10814 Galena Ct
- 10923 Suanis Ct
- 5837 Oak Forest Ln
- 10622 Carroll Wood Way
- 10682 Carroll Wood Way Unit 3
- 11345 Revere Ln
- 10560 Crecelius Dr
- 10525 Carroll Wood Way
- 10573 Carroll Wood Way
- 10080 Sakura Dr Unit 1
- 10080 Sakura Dr Unit 8
- 10819 Carroll Wood Way
- 10706 Kay Berrie Dr
- 10977 Lavinia Dr Unit 10977
- 10973 Lavinia Dr Unit 10973
- 10971 Lavinia Dr Unit 10971
- 10979 Lavinia Dr Unit 10979
- 10983 Lavinia Dr
- 10985 Lavinia Dr Unit 10985
- 11407 Concord Village Ave
- 11403 Concord Village Ave Unit 11403
- 11415 Concord Village Ave
- 11409 Concord Village Ave Unit 11409
- 11411 Concord Village Ave Unit 11411
- 11401 Concord Village Ave
- 11405 Concord Village Ave Unit A
- 10938 Lavinia Dr
- 11427 Concord Village Ave
- 10603 Village of Lavinia Ct Unit 2
- 11429 Concord Village Ave
- 10929 Lavinia Dr
- 1 Carrow Ct