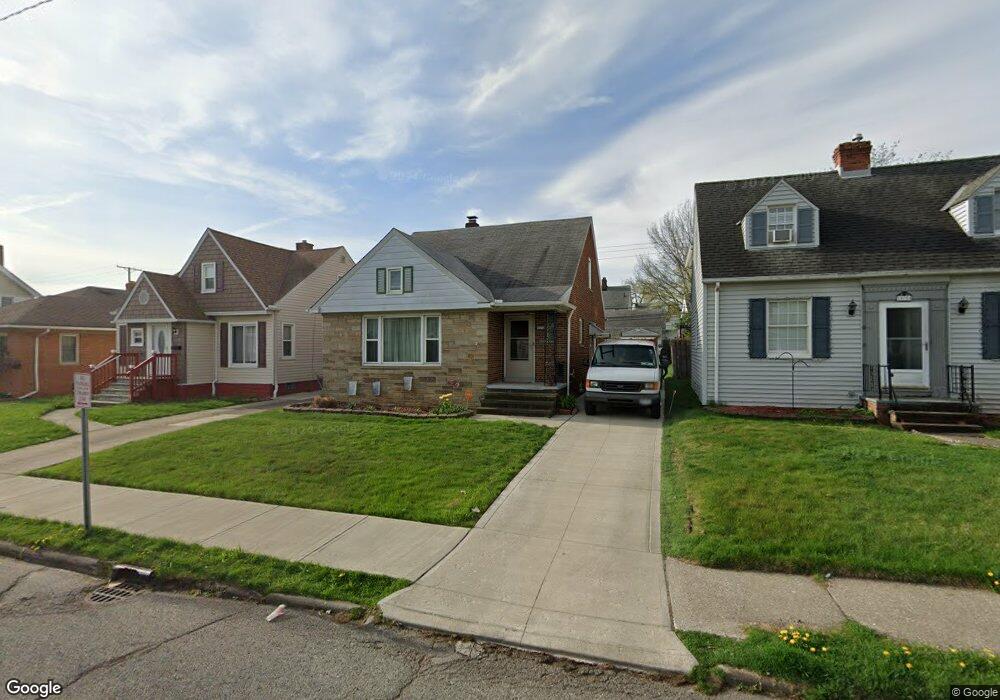
10710 Vernon Ave Cleveland, OH 44125
Estimated Value: $119,000 - $159,000
3
Beds
1
Bath
1,212
Sq Ft
$109/Sq Ft
Est. Value
About This Home
This home is located at 10710 Vernon Ave, Cleveland, OH 44125 and is currently estimated at $131,725, approximately $108 per square foot. 10710 Vernon Ave is a home located in Cuyahoga County with nearby schools including Garfield Heights High School, North Shore High School, and Trinity High School.
Ownership History
Date
Name
Owned For
Owner Type
Purchase Details
Closed on
Jun 28, 2000
Sold by
Olszewski Florence D and Olszewski Dolores M
Bought by
Burke Leonard E and Burke Brenda D
Current Estimated Value
Home Financials for this Owner
Home Financials are based on the most recent Mortgage that was taken out on this home.
Original Mortgage
$86,288
Interest Rate
8.66%
Mortgage Type
FHA
Purchase Details
Closed on
Apr 24, 1990
Sold by
Ochocki Genevieve
Bought by
Ochocki Genevieve
Purchase Details
Closed on
Nov 27, 1989
Sold by
Ochocki Genevieve
Bought by
Ochocki John
Purchase Details
Closed on
Nov 20, 1989
Sold by
John Ochocki
Bought by
Ochocki Genevieve
Purchase Details
Closed on
Sep 22, 1982
Sold by
Ochocki John and Ochocki Genevieve
Bought by
John Ochocki
Purchase Details
Closed on
Jan 1, 1975
Bought by
Ochocki John and Ochocki Genevieve
Create a Home Valuation Report for This Property
The Home Valuation Report is an in-depth analysis detailing your home's value as well as a comparison with similar homes in the area
Home Values in the Area
Average Home Value in this Area
Purchase History
| Date | Buyer | Sale Price | Title Company |
|---|---|---|---|
| Burke Leonard E | $87,000 | -- | |
| Ochocki Genevieve | -- | -- | |
| Ochocki John | -- | -- | |
| Ochocki Genevieve | -- | -- | |
| John Ochocki | -- | -- | |
| Ochocki John | -- | -- |
Source: Public Records
Mortgage History
| Date | Status | Borrower | Loan Amount |
|---|---|---|---|
| Previous Owner | Burke Leonard E | $86,288 |
Source: Public Records
Tax History Compared to Growth
Tax History
| Year | Tax Paid | Tax Assessment Tax Assessment Total Assessment is a certain percentage of the fair market value that is determined by local assessors to be the total taxable value of land and additions on the property. | Land | Improvement |
|---|---|---|---|---|
| 2024 | $4,603 | $45,500 | $7,980 | $37,520 |
| 2023 | $2,715 | $24,120 | $5,430 | $18,690 |
| 2022 | $2,674 | $24,115 | $5,425 | $18,690 |
| 2021 | $2,824 | $24,120 | $5,430 | $18,690 |
| 2020 | $2,431 | $19,290 | $4,340 | $14,950 |
| 2019 | $2,409 | $55,100 | $12,400 | $42,700 |
| 2018 | $1,252 | $19,290 | $4,340 | $14,950 |
| 2017 | $2,469 | $18,590 | $3,470 | $15,120 |
| 2016 | $2,505 | $18,590 | $3,470 | $15,120 |
| 2015 | $2,752 | $18,590 | $3,470 | $15,120 |
| 2014 | $2,752 | $22,650 | $4,240 | $18,410 |
Source: Public Records
Map
Nearby Homes
- 10718 Vernon Ave
- 10717 Park Heights Ave
- 4948 E 107th St
- 4953 E 106th St
- 10501 Park Heights Ave
- 11105 Vernon Ave
- 4935 E 109th St
- 10609 Mccracken Blvd
- 10916 Mccracken Rd
- 11006 Mccracken Rd
- 11206 Park Heights Ave
- 11016 Mccracken Rd
- 10925 Thornton Ave
- 4885 E 107th St
- 11209 Langton Ave
- 11215 Langton Ave
- 10016 Park Heights Ave
- 10408 S Highland Ave
- 10417 Grace Ave
- 10401 Grace Ave
- 10716 Vernon Ave
- 10704 Vernon Ave
- 10700 Vernon Ave
- 10715 Plymouth Ave
- 10719 Plymouth Ave
- 10711 Plymouth Ave
- 10620 Vernon Ave
- 10720 Vernon Ave
- 10721 Plymouth Ave
- 10705 Plymouth Ave
- 10709 Vernon Ave
- 10705 Vernon Ave
- 10713 Vernon Ave
- 10614 Vernon Ave
- 10725 Plymouth Ave
- 10719 Vernon Ave
- 10701 Vernon Ave
- 10701 Vernon Ave Unit 1
- 10701 Vernon Ave Unit 2
- 5031 Turney Rd