10719 Moon Valley Rd Nevada City, CA 95959
Estimated Value: $450,000 - $711,000
3
Beds
--
Bath
1,925
Sq Ft
$302/Sq Ft
Est. Value
About This Home
This home is located at 10719 Moon Valley Rd, Nevada City, CA 95959 and is currently estimated at $580,500, approximately $301 per square foot. 10719 Moon Valley Rd is a home located in Nevada County with nearby schools including Deer Creek Elementary School, Seven Hills Intermediate School, and Forest Charter School.
Ownership History
Date
Name
Owned For
Owner Type
Purchase Details
Closed on
Sep 1, 2020
Sold by
Holt Mark J and Gillespie Linda M
Bought by
Holt Mark J and Holt Linda M
Current Estimated Value
Home Financials for this Owner
Home Financials are based on the most recent Mortgage that was taken out on this home.
Original Mortgage
$300,000
Outstanding Balance
$265,736
Interest Rate
2.8%
Mortgage Type
New Conventional
Estimated Equity
$314,764
Purchase Details
Closed on
Apr 7, 2003
Sold by
Sterling Carolyn French
Bought by
Holt Mark J and Gillespie Linda M
Purchase Details
Closed on
Jul 29, 2002
Sold by
Warr Pryer Sterling
Bought by
Sterling Carolyn French
Home Financials for this Owner
Home Financials are based on the most recent Mortgage that was taken out on this home.
Original Mortgage
$185,000
Interest Rate
6.6%
Mortgage Type
Purchase Money Mortgage
Purchase Details
Closed on
Jun 7, 2000
Sold by
Lemberger Arnold W Trust
Bought by
Sterling Carolyn French
Create a Home Valuation Report for This Property
The Home Valuation Report is an in-depth analysis detailing your home's value as well as a comparison with similar homes in the area
Home Values in the Area
Average Home Value in this Area
Purchase History
| Date | Buyer | Sale Price | Title Company |
|---|---|---|---|
| Holt Mark J | -- | None Available | |
| Holt Mark J | -- | Fidelity National Title Co | |
| Sterling Carolyn French | -- | Fidelity National Title Co | |
| Sterling Carolyn French | -- | -- |
Source: Public Records
Mortgage History
| Date | Status | Borrower | Loan Amount |
|---|---|---|---|
| Open | Holt Mark J | $300,000 | |
| Previous Owner | Sterling Carolyn French | $185,000 |
Source: Public Records
Tax History Compared to Growth
Tax History
| Year | Tax Paid | Tax Assessment Tax Assessment Total Assessment is a certain percentage of the fair market value that is determined by local assessors to be the total taxable value of land and additions on the property. | Land | Improvement |
|---|---|---|---|---|
| 2025 | $1,604 | $125,912 | $39,171 | $86,741 |
| 2024 | $1,564 | $123,444 | $38,403 | $85,041 |
| 2023 | $1,564 | $121,024 | $37,650 | $83,374 |
| 2022 | $1,529 | $118,652 | $36,912 | $81,740 |
| 2021 | $1,476 | $116,327 | $36,189 | $80,138 |
| 2020 | $1,466 | $115,135 | $35,818 | $79,317 |
| 2019 | $1,433 | $112,878 | $35,116 | $77,762 |
| 2018 | $1,402 | $110,666 | $34,428 | $76,238 |
| 2017 | $1,372 | $108,497 | $33,753 | $74,744 |
| 2016 | $1,324 | $106,371 | $33,092 | $73,279 |
| 2015 | $1,302 | $104,774 | $32,595 | $72,179 |
| 2014 | $1,279 | $102,723 | $31,957 | $70,766 |
Source: Public Records
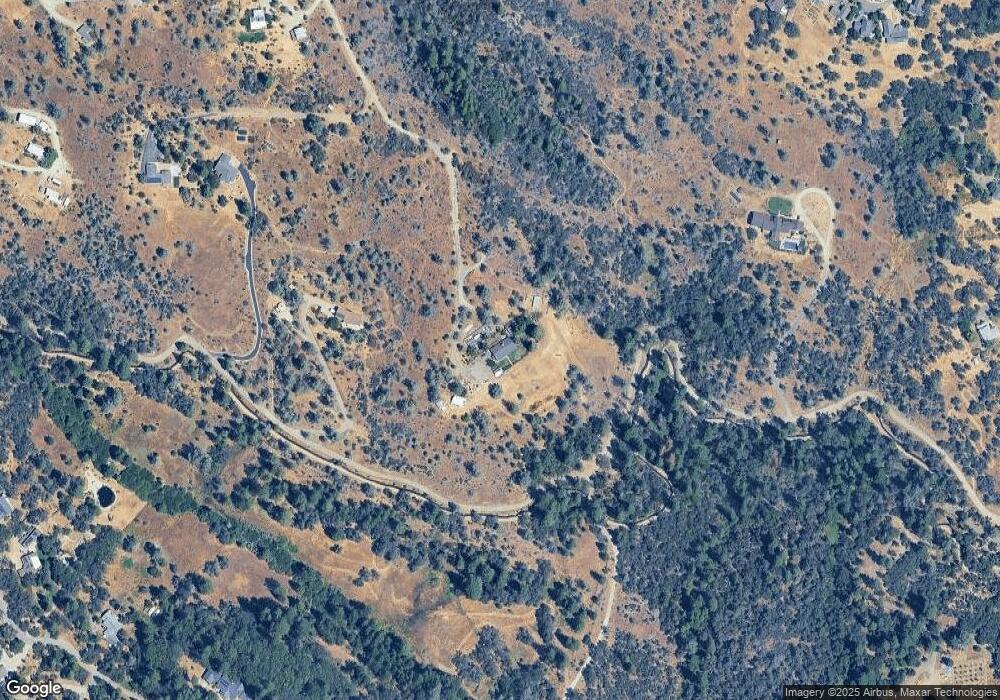
Map
Nearby Homes
- 10265 Newtown Rd
- 10402 Newtown Rd
- 16934 Indian Flat Rd
- 10980 Newtown Rd
- 12921 Slate Creek Rd
- 10943 Beckville Rd
- 11065 White Oak Way
- 11356 Constitution Ct
- 11912 Deer Park Dr
- 11772 Marjon Dr
- 11220 Marjon Dr
- 11208 Ridge Rd
- 118 Sierra Blanca Ct
- 11094 Cement Hill Rd
- 12776 Little Deer Creek Ln
- 196 Northridge Dr
- 124 Ruby Ledge Ct
- 16970 Old Downieville Hwy
- 167 Northridge Dr
- 111 Egret Place
- 17492 Champion Rd
- 17190 Champion Rd
- 17560 Champion Rd
- 17417 Champion Mine Rd
- 10587 Moon Valley Rd
- 10794 Moon Valley Rd
- 10955 Morning Star Ln
- 16926 Oak Hollow Cir
- 16912 Oak Hollow Cir
- 16966 Blue Sky Cir
- 16940 Oak Hollow Cir
- 10877 Morning Star Ln
- 16974 Blue Sky Cir
- 16880 Oak Hollow Cir
- 16916 Oak Hollow Cir
- 16909 Oak Hollow Cir
- 10901 Moon Valley Rd
- 16986 Blue Sky Cir
- 10461 Newtown Rd
- 16931 Oak Hollow Cir