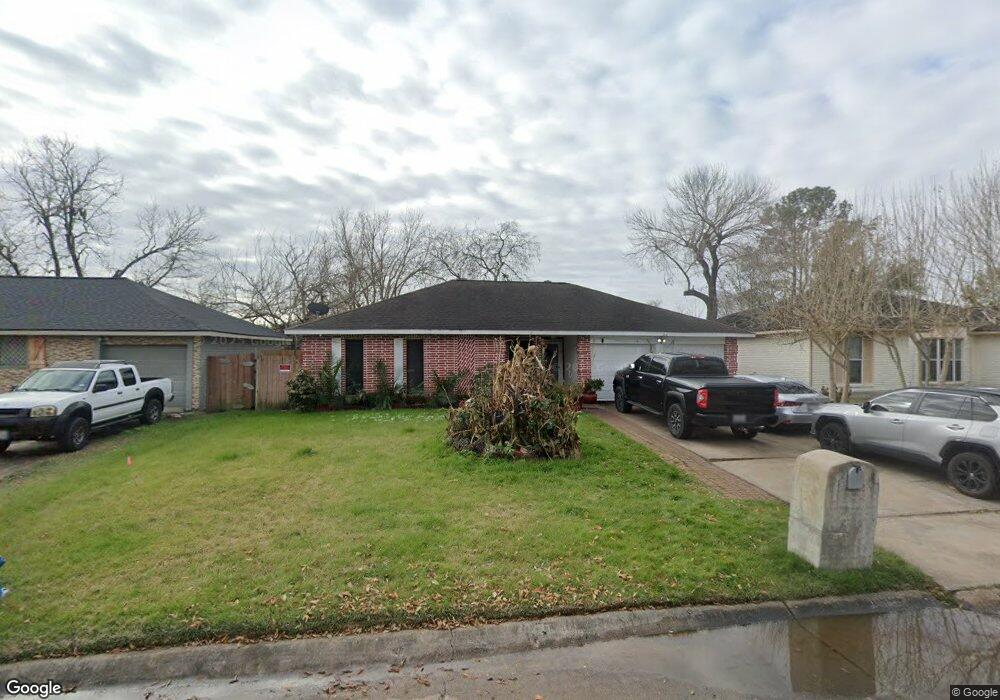
10723 Langdon Ln Houston, TX 77072
Alief NeighborhoodEstimated Value: $194,000 - $210,000
3
Beds
2
Baths
1,207
Sq Ft
$167/Sq Ft
Est. Value
About This Home
This home is located at 10723 Langdon Ln, Houston, TX 77072 and is currently estimated at $201,934, approximately $167 per square foot. 10723 Langdon Ln is a home located in Harris County with nearby schools including Chambers Elementary School, Owens Intermediate School, and Hastings High School.
Ownership History
Date
Name
Owned For
Owner Type
Purchase Details
Closed on
Aug 22, 2007
Sold by
Barber Mary
Bought by
Gutierrez Jose and Gutierrez Vicenta
Current Estimated Value
Home Financials for this Owner
Home Financials are based on the most recent Mortgage that was taken out on this home.
Original Mortgage
$99,750
Interest Rate
3.92%
Mortgage Type
New Conventional
Purchase Details
Closed on
Jul 13, 2006
Sold by
Tubbs Christopher
Bought by
10723 Langdon Trust
Purchase Details
Closed on
Apr 7, 2006
Sold by
Jones Mary Ann
Bought by
Tubbs Chris
Home Financials for this Owner
Home Financials are based on the most recent Mortgage that was taken out on this home.
Original Mortgage
$70,700
Interest Rate
6.22%
Mortgage Type
Purchase Money Mortgage
Purchase Details
Closed on
Jun 5, 2001
Sold by
Wilkson William Roger
Bought by
Jones Mary Ann
Home Financials for this Owner
Home Financials are based on the most recent Mortgage that was taken out on this home.
Original Mortgage
$30,000
Interest Rate
6.57%
Mortgage Type
Seller Take Back
Create a Home Valuation Report for This Property
The Home Valuation Report is an in-depth analysis detailing your home's value as well as a comparison with similar homes in the area
Home Values in the Area
Average Home Value in this Area
Purchase History
| Date | Buyer | Sale Price | Title Company |
|---|---|---|---|
| Gutierrez Jose | -- | None Available | |
| 10723 Langdon Trust | -- | None Available | |
| Tubbs Chris | -- | Etc | |
| Jones Mary Ann | -- | -- |
Source: Public Records
Mortgage History
| Date | Status | Borrower | Loan Amount |
|---|---|---|---|
| Previous Owner | Gutierrez Jose | $99,750 | |
| Previous Owner | Tubbs Chris | $70,700 | |
| Previous Owner | Jones Mary Ann | $30,000 |
Source: Public Records
Tax History Compared to Growth
Tax History
| Year | Tax Paid | Tax Assessment Tax Assessment Total Assessment is a certain percentage of the fair market value that is determined by local assessors to be the total taxable value of land and additions on the property. | Land | Improvement |
|---|---|---|---|---|
| 2025 | $4,308 | $189,622 | $56,100 | $133,522 |
| 2024 | $4,308 | $189,622 | $56,100 | $133,522 |
| 2023 | $4,308 | $179,696 | $56,100 | $123,596 |
| 2022 | $4,182 | $172,391 | $42,900 | $129,491 |
| 2021 | $3,473 | $142,278 | $36,300 | $105,978 |
| 2020 | $3,472 | $137,303 | $36,300 | $101,003 |
| 2019 | $2,997 | $108,821 | $19,800 | $89,021 |
| 2018 | $1,363 | $102,451 | $19,800 | $82,651 |
| 2017 | $2,656 | $97,392 | $19,800 | $77,592 |
| 2016 | $2,100 | $77,000 | $19,800 | $57,200 |
| 2015 | $688 | $83,846 | $19,800 | $64,046 |
| 2014 | $688 | $53,759 | $19,800 | $33,959 |
Source: Public Records
Map
Nearby Homes
- 10903 Sela Ln
- 11022 Concho St
- 11127 Village Bend Ln Unit 1127
- 11136 Village Bend Ln Unit 1136
- 10927 Sandstone St
- 8323 Wilcrest Dr Unit 12010
- 10555 Turtlewood Ct Unit 2303
- 10555 Turtlewood Ct Unit 1803
- 10555 Turtlewood Ct Unit 2105
- 10555 Turtlewood Ct Unit 210
- 10555 Turtlewood Ct Unit 1408
- 10555 Turtlewood Ct Unit 2003
- 10555 Turtlewood Ct Unit 1510
- 10555 Turtlewood Ct Unit 3012
- 10555 Turtlewood Ct Unit 909
- 10555 Turtlewood Ct Unit 405
- 10555 Turtlewood Ct Unit 2601
- 10555 Turtlewood Ct Unit 414
- 10555 Turtlewood Ct Unit 2011
- 10555 Turtlewood Ct Unit 2802
- 10719 Langdon Ln
- 10727 Langdon Ln
- 10746 Concho St
- 10715 Langdon Ln
- 10731 Langdon Ln
- 10742 Concho St
- 10750 Concho St
- 10738 Concho St
- 10802 Concho St
- 10735 Langdon Ln
- 10711 Langdon Ln
- 10722 Langdon Ln
- 10726 Langdon Ln
- 10718 Langdon Ln
- 10734 Concho St
- 10730 Langdon Ln
- 10806 Concho St
- 10714 Langdon Ln
- 10707 Langdon Ln
- 10803 Langdon Ln