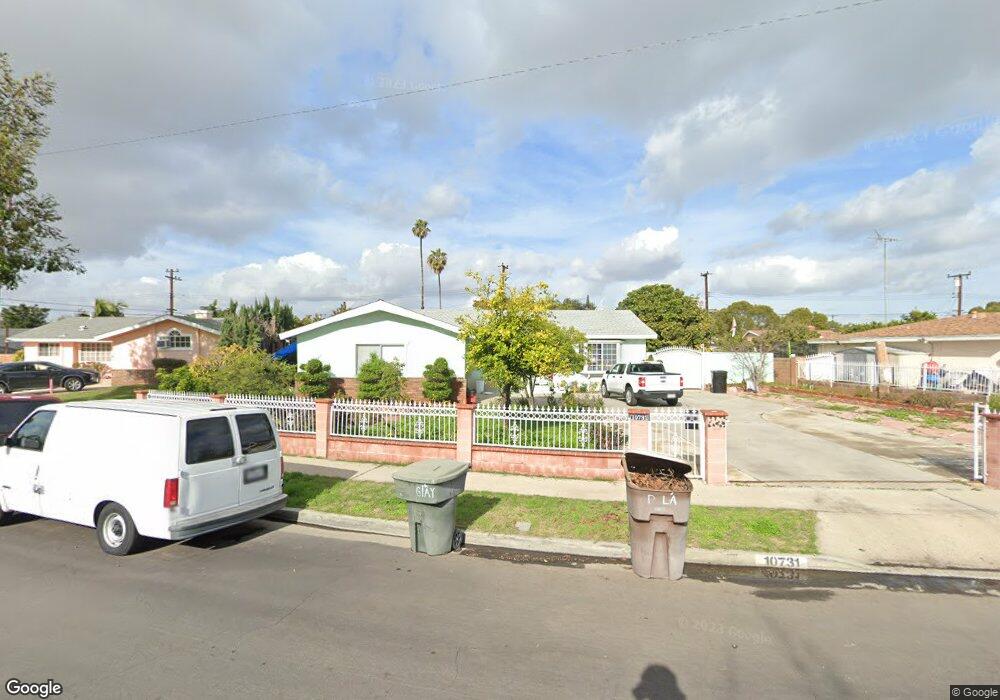
10731 Catalina St Garden Grove, CA 92843
Little Saigon NeighborhoodEstimated Value: $948,000 - $1,160,331
4
Beds
3
Baths
1,862
Sq Ft
$587/Sq Ft
Est. Value
About This Home
This home is located at 10731 Catalina St, Garden Grove, CA 92843 and is currently estimated at $1,093,083, approximately $587 per square foot. 10731 Catalina St is a home located in Orange County with nearby schools including Post Elementary, James Irvine Intermediate School, and La Quinta High School.
Ownership History
Date
Name
Owned For
Owner Type
Purchase Details
Closed on
Mar 19, 2003
Sold by
Tran Anthony Vu and Tran Vu Quoc
Bought by
Tran Anthony Vu
Current Estimated Value
Home Financials for this Owner
Home Financials are based on the most recent Mortgage that was taken out on this home.
Original Mortgage
$177,000
Interest Rate
5.78%
Purchase Details
Closed on
Feb 13, 2002
Sold by
Tran Anh Quoc and Huynh Lien Hoa Thi
Bought by
Tran Vu Quoc
Home Financials for this Owner
Home Financials are based on the most recent Mortgage that was taken out on this home.
Original Mortgage
$180,000
Interest Rate
7.04%
Purchase Details
Closed on
Oct 13, 2000
Sold by
Van Le Vinh and Van Kim L
Bought by
Tran Anh Quoc and Huynh Lien Hoa Thi
Home Financials for this Owner
Home Financials are based on the most recent Mortgage that was taken out on this home.
Original Mortgage
$168,000
Interest Rate
7.9%
Purchase Details
Closed on
Aug 4, 1999
Sold by
Van Le Vinh and Van Kim L
Bought by
Vanvanle Vinh Van and Nguyen Kim Loan
Create a Home Valuation Report for This Property
The Home Valuation Report is an in-depth analysis detailing your home's value as well as a comparison with similar homes in the area
Home Values in the Area
Average Home Value in this Area
Purchase History
| Date | Buyer | Sale Price | Title Company |
|---|---|---|---|
| Tran Anthony Vu | -- | Southland Title | |
| Tran Vu Quoc | -- | Southland Title | |
| Tran Anh Quoc | $210,000 | Orange Coast Title Company | |
| Vanvanle Vinh Van | -- | -- |
Source: Public Records
Mortgage History
| Date | Status | Borrower | Loan Amount |
|---|---|---|---|
| Closed | Tran Anthony Vu | $177,000 | |
| Closed | Tran Vu Quoc | $180,000 | |
| Closed | Tran Anh Quoc | $168,000 |
Source: Public Records
Tax History Compared to Growth
Tax History
| Year | Tax Paid | Tax Assessment Tax Assessment Total Assessment is a certain percentage of the fair market value that is determined by local assessors to be the total taxable value of land and additions on the property. | Land | Improvement |
|---|---|---|---|---|
| 2025 | $4,882 | $392,667 | $253,943 | $138,724 |
| 2024 | $4,882 | $384,968 | $248,964 | $136,004 |
| 2023 | $4,789 | $377,420 | $244,082 | $133,338 |
| 2022 | $4,685 | $370,020 | $239,296 | $130,724 |
| 2021 | $4,634 | $362,765 | $234,604 | $128,161 |
| 2020 | $4,572 | $359,046 | $232,199 | $126,847 |
| 2019 | $4,485 | $352,006 | $227,646 | $124,360 |
| 2018 | $4,395 | $345,104 | $223,182 | $121,922 |
| 2017 | $4,333 | $338,338 | $218,806 | $119,532 |
| 2016 | $4,219 | $340,218 | $214,515 | $125,703 |
| 2015 | $4,159 | $335,108 | $211,293 | $123,815 |
| 2014 | $4,058 | $328,544 | $207,154 | $121,390 |
Source: Public Records
Map
Nearby Homes
- 5317 Silver Dr
- 10886 Lotus Dr
- 5405 W 4th St
- 14356 Taft St
- 13322 Euclid St
- 14376 Euclid St Unit 1-4
- 323 N Euclid St Unit 99
- 14151 Lake St
- 4832 W 5th St Unit B
- 10632 Henderson Ave
- 5132 W 1st St Unit B
- 5112 W 1st St Unit C
- 5114 W 1st St Unit C
- 14171 Flower St
- 10562 Davit Ave
- 10061 15th St
- 1609 N Parsons Place
- 4518 W 1st St
- 9884 11th St
- 9906 13th St
- 10721 Catalina St
- 5515 Roosevelt Ave
- 10732 Rhonda Ave
- 5514 Rhonda Ave
- 10722 Catalina St
- 10701 Catalina St
- 10722 Rhonda Ave
- 5507 Roosevelt Ave
- 5510 Rhonda Ave
- 10702 Catalina St
- 5520 Roosevelt Ave
- 14651 Taft St
- 5518 Roosevelt Ave
- 10702 Rhonda Ave
- 10691 Catalina St
- 5506 Rhonda Ave
- 5505 Roosevelt Ave
- 5514 Roosevelt Ave
- 10692 Catalina St
- 5510 Roosevelt Ave