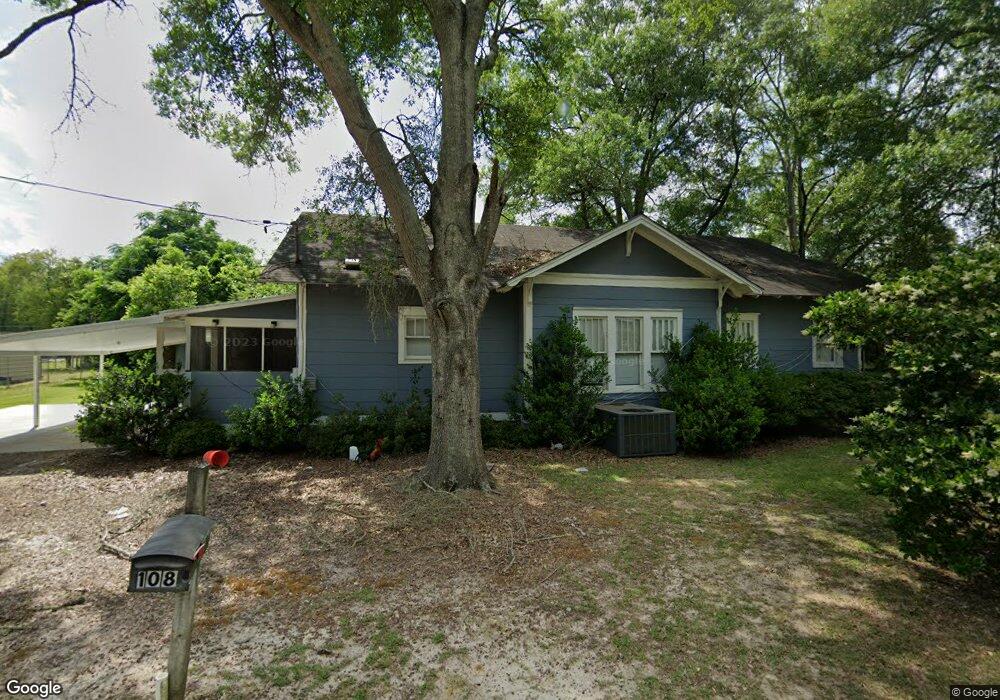
108 9th Ave Fitzgerald, GA 31750
Estimated Value: $103,000 - $165,000
3
Beds
2
Baths
1,708
Sq Ft
$77/Sq Ft
Est. Value
About This Home
This home is located at 108 9th Ave, Fitzgerald, GA 31750 and is currently estimated at $131,929, approximately $77 per square foot. 108 9th Ave is a home located in Ben Hill County with nearby schools including Ben Hill County Primary School, Ben Hill Elementary School, and Ben Hill County Middle School.
Ownership History
Date
Name
Owned For
Owner Type
Purchase Details
Closed on
Jan 16, 2018
Sold by
Le Tuan
Bought by
Le Tuan Bao and Nguyen Thien Kieu
Current Estimated Value
Purchase Details
Closed on
Dec 29, 2017
Sold by
Reverse Mtg Solutions Inc
Bought by
Le Tuan
Purchase Details
Closed on
Aug 1, 2017
Sold by
Bedingfield Brenda
Bought by
Reverse Mtg Solutions Inc
Purchase Details
Closed on
Apr 11, 2003
Sold by
Yarbrough Melissa Dianne
Bought by
Bedingfield James and Bedingfield Brenda S
Purchase Details
Closed on
Aug 27, 2002
Sold by
Yarbrough Julian
Bought by
Yarbrough Melissa Dianne
Purchase Details
Closed on
Feb 1, 1998
Sold by
Yarbrough Melissa D
Bought by
Yarbrough Julian
Purchase Details
Closed on
Dec 5, 1997
Sold by
Yarbrough Julian M
Bought by
Yarbrough Melissa D
Purchase Details
Closed on
Sep 29, 1995
Sold by
Yarbrough Julian M
Bought by
Yarbrough Julian M
Purchase Details
Closed on
Mar 31, 1978
Bought by
Yarbrough Julian M
Create a Home Valuation Report for This Property
The Home Valuation Report is an in-depth analysis detailing your home's value as well as a comparison with similar homes in the area
Home Values in the Area
Average Home Value in this Area
Purchase History
| Date | Buyer | Sale Price | Title Company |
|---|---|---|---|
| Le Tuan Bao | -- | -- | |
| Le Tuan | $20,000 | -- | |
| Reverse Mtg Solutions Inc | $38,000 | -- | |
| Bedingfield James | $40,500 | -- | |
| Yarbrough Melissa Dianne | -- | -- | |
| Yarbrough Julian | -- | -- | |
| Yarbrough Melissa D | -- | -- | |
| Yarbrough Julian M | -- | -- | |
| Yarbrough Julian M | -- | -- |
Source: Public Records
Tax History Compared to Growth
Tax History
| Year | Tax Paid | Tax Assessment Tax Assessment Total Assessment is a certain percentage of the fair market value that is determined by local assessors to be the total taxable value of land and additions on the property. | Land | Improvement |
|---|---|---|---|---|
| 2024 | $1,187 | $27,811 | $2,400 | $25,411 |
| 2023 | $830 | $27,074 | $2,400 | $24,674 |
| 2022 | $773 | $23,384 | $2,400 | $20,984 |
| 2021 | $657 | $19,127 | $2,400 | $16,727 |
| 2020 | $661 | $19,014 | $2,400 | $16,614 |
| 2019 | $433 | $12,500 | $2,400 | $10,100 |
| 2018 | $540 | $12,533 | $2,400 | $10,133 |
| 2017 | $316 | $15,094 | $2,400 | $12,694 |
| 2016 | $396 | $17,904 | $2,400 | $15,504 |
| 2015 | -- | $18,065 | $2,400 | $15,665 |
| 2014 | -- | $18,388 | $2,400 | $15,988 |
Source: Public Records
Map
Nearby Homes
- 906 N Merrimac Dr
- 608 W Sultana Dr
- 123 Blueberry Ln
- 502 W Alapaha St
- 103 Meadowood Ln
- 606 W Suwanee St
- 141 Turner Ave
- 807 W Oconee St
- 118 Patton Ave
- 124 Patton Ave
- 124 N Main Street Extension
- 303 W Altamaha St
- 616 N Main St
- 115 Easy St
- 109 Pearl Place
- 613 W Central Ave
- 137 Atlantic Ave
- 102 Irwinville Hwy
- 503 N Main St
- 118 Irwinville Hwy
- 909 N Merrimac Dr
- 113 9th Ave
- 136 Northwood Dr
- 807 W Sultana Dr
- 809 W Sultana Dr
- 815 W Sultana Dr
- 803 W Sultana Dr
- 132 Northwood Dr
- 801 W Sultana Dr
- 908 N Merrimac Dr
- 910 N Merrimac Dr
- 715 W Sultana Dr
- 912 N Merrimac Dr
- 906 N Merrimac Drive Extension
- 137 Northwood Dr
- 139 Northwood Dr
- 904 N Merrimac Dr
- 126 Northwood Dr
- 919 N Merrimac Drive Extension
- 912 N Merrimac Drive Extension