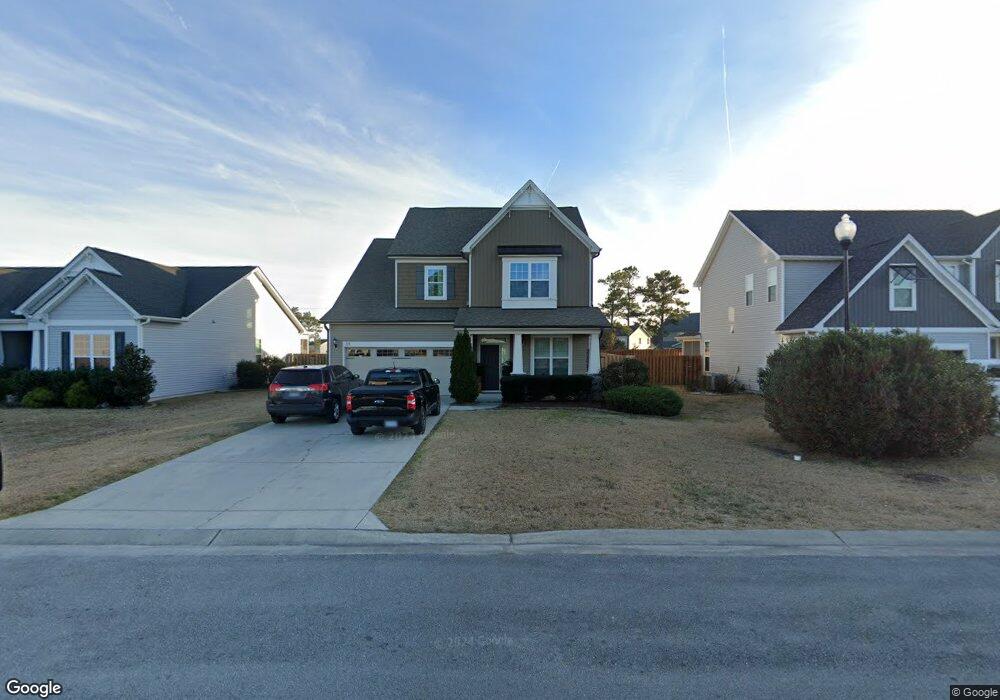
108 Hampton Dr Holly Ridge, NC 28445
Estimated Value: $400,626 - $536,000
3
Beds
3
Baths
2,209
Sq Ft
$204/Sq Ft
Est. Value
About This Home
This home is located at 108 Hampton Dr, Holly Ridge, NC 28445 and is currently estimated at $450,407, approximately $203 per square foot. 108 Hampton Dr is a home located in Onslow County with nearby schools including Coastal Elementary, Dixon Elementary School, and Dixon High School.
Ownership History
Date
Name
Owned For
Owner Type
Purchase Details
Closed on
Jul 3, 2020
Sold by
Ruark Connor M
Bought by
Jordan Eric C and Jordan Jennifer E
Current Estimated Value
Home Financials for this Owner
Home Financials are based on the most recent Mortgage that was taken out on this home.
Original Mortgage
$258,726
Outstanding Balance
$229,421
Interest Rate
3.1%
Mortgage Type
FHA
Estimated Equity
$220,986
Purchase Details
Closed on
Aug 23, 2018
Sold by
Newson Michael M and Newson Rhonda R
Bought by
Ruark Connor M
Home Financials for this Owner
Home Financials are based on the most recent Mortgage that was taken out on this home.
Original Mortgage
$242,606
Interest Rate
4.5%
Mortgage Type
VA
Purchase Details
Closed on
Mar 11, 2014
Sold by
Robuck Homes Triangle Llc
Bought by
Newson Michael M and Newson Rhonda M
Home Financials for this Owner
Home Financials are based on the most recent Mortgage that was taken out on this home.
Original Mortgage
$239,000
Interest Rate
4.4%
Mortgage Type
VA
Create a Home Valuation Report for This Property
The Home Valuation Report is an in-depth analysis detailing your home's value as well as a comparison with similar homes in the area
Home Values in the Area
Average Home Value in this Area
Purchase History
| Date | Buyer | Sale Price | Title Company |
|---|---|---|---|
| Jordan Eric C | $263,500 | None Available | |
| Ruark Connor M | $237,500 | None Available | |
| Newson Michael M | $239,000 | None Available |
Source: Public Records
Mortgage History
| Date | Status | Borrower | Loan Amount |
|---|---|---|---|
| Open | Jordan Eric C | $258,726 | |
| Previous Owner | Ruark Connor M | $242,606 | |
| Previous Owner | Newson Michael M | $239,000 |
Source: Public Records
Tax History Compared to Growth
Tax History
| Year | Tax Paid | Tax Assessment Tax Assessment Total Assessment is a certain percentage of the fair market value that is determined by local assessors to be the total taxable value of land and additions on the property. | Land | Improvement |
|---|---|---|---|---|
| 2025 | $3,397 | $341,425 | $45,000 | $296,425 |
| 2024 | $3,397 | $341,425 | $45,000 | $296,425 |
| 2023 | $3,397 | $341,425 | $45,000 | $296,425 |
| 2022 | $3,431 | $341,425 | $45,000 | $296,425 |
| 2021 | $2,529 | $230,930 | $40,000 | $190,930 |
| 2020 | $2,529 | $230,930 | $40,000 | $190,930 |
| 2019 | $2,540 | $230,930 | $40,000 | $190,930 |
| 2018 | $2,064 | $230,930 | $40,000 | $190,930 |
| 2017 | $2,027 | $230,950 | $50,000 | $180,950 |
| 2016 | $2,517 | $230,950 | $0 | $0 |
| 2015 | $2,517 | $230,950 | $0 | $0 |
| 2014 | $2,517 | $230,950 | $0 | $0 |
Source: Public Records
Map
Nearby Homes
- 110 Hampton Dr
- 359 Belvedere Dr
- 229 Red Carnation Dr
- 206 Holden Rd
- 1213 Daisy Ct
- 204 Red Carnation Dr
- 807 Wildflower Dr
- 134 Merry Ln
- 437 Belvedere Dr
- 435 Belvedere Dr
- 301 Log Cabin Way
- 17 Off
- 202 Bungalow Rd
- 8 Hwy 50
- 77 Sandy Ln
- 767 E Ocean Rd
- 156 Poplar Branch Way
- 129 Poplar Branch Way
- 121 Poplar Branch Way
- 1001 Mabel Rawlinson Dr
- 108 Hampton Dr
- 106 Hampton Dr
- 104 Hampton Dr
- 112 Hampton Dr
- 112 Hampton Dr
- 111 Hampton Dr
- 114 Hampton Dr
- 102 Hampton Dr
- 114 Hampton Dr
- 201 Willow Ridge Dr
- 107 Hampton Dr
- 107 Hampton Dr
- 113 Hampton Dr
- 116 Hampton Dr
- 100 Hampton Dr
- 202 Willow Ridge Dr
- 203 Willow Ridge Dr
- 308 Belvedere Dr
- 308 Belvedere Dr
- 310 Belvedere Dr