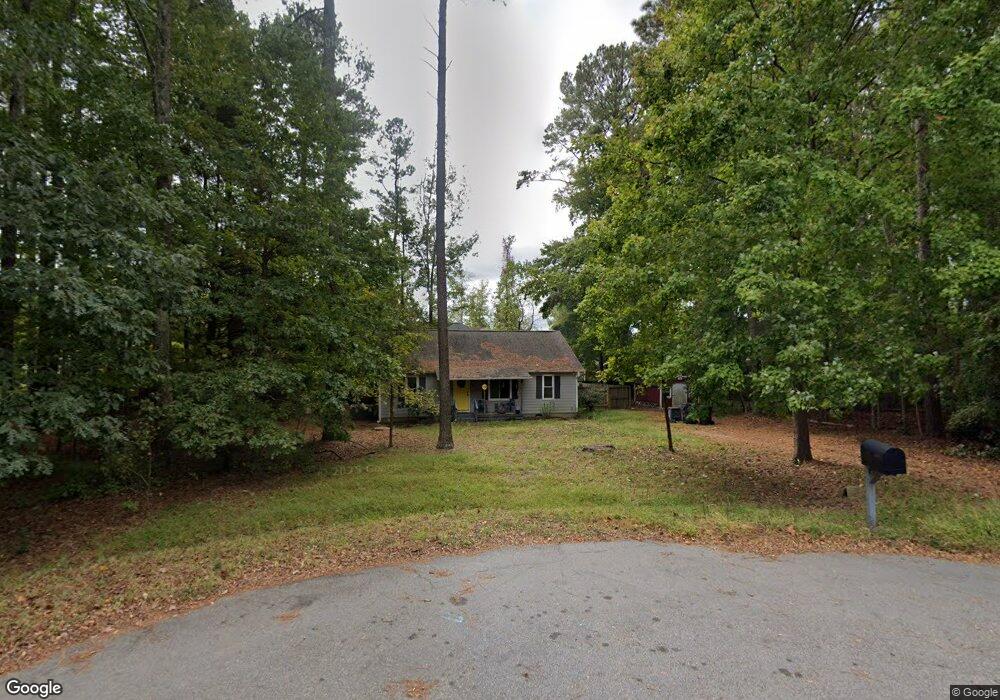
108 Hines Ct Youngsville, NC 27596
Estimated Value: $248,000 - $273,000
3
Beds
2
Baths
1,000
Sq Ft
$260/Sq Ft
Est. Value
About This Home
This home is located at 108 Hines Ct, Youngsville, NC 27596 and is currently estimated at $260,291, approximately $260 per square foot. 108 Hines Ct is a home located in Franklin County with nearby schools including Long Mill Elementary, Cedar Creek Middle, and Franklinton High School.
Ownership History
Date
Name
Owned For
Owner Type
Purchase Details
Closed on
Aug 6, 2018
Sold by
Baggett Mark Eliott and Baggett Emily Dawn
Bought by
Burkhardt Jana Marie
Current Estimated Value
Home Financials for this Owner
Home Financials are based on the most recent Mortgage that was taken out on this home.
Original Mortgage
$149,494
Outstanding Balance
$129,829
Interest Rate
4.5%
Mortgage Type
New Conventional
Estimated Equity
$130,462
Purchase Details
Closed on
Sep 3, 2015
Sold by
Hoffmann Robert and Hoffmann Mary Ellen A
Bought by
Baggett Mark Elliot and Scott Emily Dawn
Home Financials for this Owner
Home Financials are based on the most recent Mortgage that was taken out on this home.
Original Mortgage
$99,897
Interest Rate
3.97%
Mortgage Type
New Conventional
Purchase Details
Closed on
Apr 7, 2004
Bought by
Hoffmann Robert and Mary Ellen A
Create a Home Valuation Report for This Property
The Home Valuation Report is an in-depth analysis detailing your home's value as well as a comparison with similar homes in the area
Home Values in the Area
Average Home Value in this Area
Purchase History
| Date | Buyer | Sale Price | Title Company |
|---|---|---|---|
| Burkhardt Jana Marie | $148,000 | None Available | |
| Baggett Mark Elliot | $98,000 | None Available | |
| Hoffmann Robert | $73,000 | -- |
Source: Public Records
Mortgage History
| Date | Status | Borrower | Loan Amount |
|---|---|---|---|
| Open | Burkhardt Jana Marie | $149,494 | |
| Previous Owner | Baggett Mark Elliot | $99,897 |
Source: Public Records
Tax History Compared to Growth
Tax History
| Year | Tax Paid | Tax Assessment Tax Assessment Total Assessment is a certain percentage of the fair market value that is determined by local assessors to be the total taxable value of land and additions on the property. | Land | Improvement |
|---|---|---|---|---|
| 2024 | $1,400 | $217,480 | $68,250 | $149,230 |
| 2023 | $1,190 | $122,620 | $30,000 | $92,620 |
| 2022 | $1,180 | $122,620 | $30,000 | $92,620 |
| 2021 | $1,185 | $122,620 | $30,000 | $92,620 |
| 2020 | $1,192 | $122,620 | $30,000 | $92,620 |
| 2019 | $1,182 | $122,620 | $30,000 | $92,620 |
| 2018 | $1,171 | $122,620 | $30,000 | $92,620 |
| 2017 | $978 | $92,100 | $30,000 | $62,100 |
| 2016 | $1,010 | $92,100 | $30,000 | $62,100 |
| 2015 | $1,010 | $92,100 | $30,000 | $62,100 |
| 2014 | $937 | $92,100 | $30,000 | $62,100 |
Source: Public Records
Map
Nearby Homes
- 105 Hines Ct
- 20 James Joyce Ct
- 40 Oscar Wilde Way
- 109 Shearin Ct
- 325 Paddy Ln
- 96 Madeline Ct
- 195 Eagle Stone Ridge
- 25 Paddy Ln
- 101 New Castle Ct
- 1045 Peony Ln
- 1047 Peony Ln
- 1043 Peony Ln
- 1027 Peony Ln
- 108 Madeline Ct
- 65 Beaver Ridge Dr
- 146 Clark Ct
- 132 Waiters Way
- 65 Spanish Oak Dr
- 30 Bethany Ln
- Amelia Plan at Hidden Lake - The Enclave at - 55+ Community
- 200 Paddy Ln
- 104 Hines Ct
- 210 Paddy Ln
- 190 Paddy Ln
- 220 Paddy Ln
- 180 Paddy Ln
- 145 Mill Creek Dr
- 149 Mill Creek Dr
- 149 Mill Creek Church Rd
- 113 Hines Ct
- 170 Paddy Ln
- 137 Mill Creek Dr
- 195 Paddy Ln
- 205 Paddy Ln
- 185 Paddy Ln
- 215 Paddy Ln
- 153 Mill Creek Dr
- 160 Paddy Ln
- 160 Paddy Ln Unit 83
- 75 Oscar Wilde Way