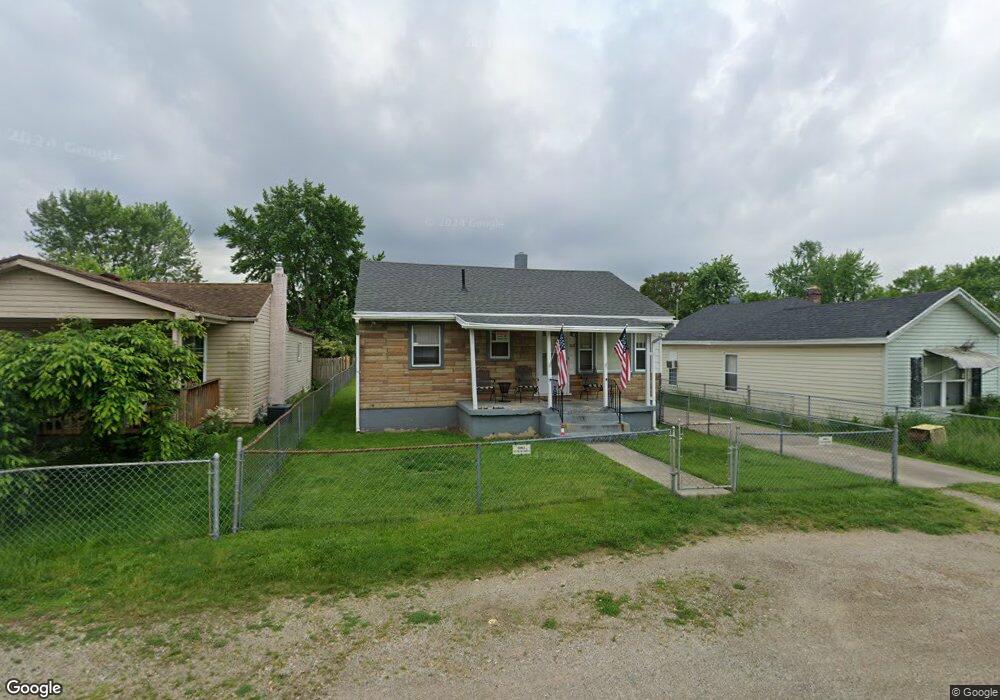
108 Rohrer Blvd Dayton, OH 45404
Avondale NeighborhoodEstimated Value: $63,000 - $76,000
2
Beds
1
Bath
720
Sq Ft
$98/Sq Ft
Est. Value
About This Home
This home is located at 108 Rohrer Blvd, Dayton, OH 45404 and is currently estimated at $70,635, approximately $98 per square foot. 108 Rohrer Blvd is a home located in Montgomery County with nearby schools including Stebbins High School, Pathway School of Discovery, and Liberty High School.
Ownership History
Date
Name
Owned For
Owner Type
Purchase Details
Closed on
Sep 9, 2013
Sold by
Threek Investments Llc
Bought by
Haynes Terry A and Haynes Sophia M
Current Estimated Value
Home Financials for this Owner
Home Financials are based on the most recent Mortgage that was taken out on this home.
Original Mortgage
$27,983
Outstanding Balance
$20,757
Interest Rate
4.25%
Mortgage Type
FHA
Estimated Equity
$49,878
Purchase Details
Closed on
Jul 26, 2011
Sold by
Duncan Roscoe
Bought by
Threek Investments Llc
Purchase Details
Closed on
Dec 22, 2008
Sold by
Noe Carolyn
Bought by
Duncan Roscoe
Home Financials for this Owner
Home Financials are based on the most recent Mortgage that was taken out on this home.
Original Mortgage
$25,000
Interest Rate
6.19%
Mortgage Type
Seller Take Back
Purchase Details
Closed on
Mar 3, 2003
Sold by
Estate Of Paul Oliver Duncan
Bought by
Duncan Myrtle C
Create a Home Valuation Report for This Property
The Home Valuation Report is an in-depth analysis detailing your home's value as well as a comparison with similar homes in the area
Home Values in the Area
Average Home Value in this Area
Purchase History
| Date | Buyer | Sale Price | Title Company |
|---|---|---|---|
| Haynes Terry A | $28,500 | None Available | |
| Threek Investments Llc | -- | Attorney | |
| Duncan Roscoe | $25,000 | None Available | |
| Duncan Myrtle C | -- | -- |
Source: Public Records
Mortgage History
| Date | Status | Borrower | Loan Amount |
|---|---|---|---|
| Open | Haynes Terry A | $27,983 | |
| Previous Owner | Duncan Roscoe | $25,000 |
Source: Public Records
Tax History Compared to Growth
Tax History
| Year | Tax Paid | Tax Assessment Tax Assessment Total Assessment is a certain percentage of the fair market value that is determined by local assessors to be the total taxable value of land and additions on the property. | Land | Improvement |
|---|---|---|---|---|
| 2024 | $823 | $16,460 | $4,490 | $11,970 |
| 2023 | $823 | $16,460 | $4,490 | $11,970 |
| 2022 | $877 | $13,160 | $3,590 | $9,570 |
| 2021 | $893 | $13,160 | $3,590 | $9,570 |
| 2020 | $890 | $13,110 | $3,590 | $9,520 |
| 2019 | $947 | $12,520 | $3,230 | $9,290 |
| 2018 | $949 | $12,520 | $3,230 | $9,290 |
| 2017 | $949 | $12,520 | $3,230 | $9,290 |
| 2016 | $957 | $12,260 | $3,590 | $8,670 |
| 2015 | $1,094 | $12,260 | $3,590 | $8,670 |
| 2014 | $1,094 | $12,260 | $3,590 | $8,670 |
| 2012 | -- | $16,460 | $3,590 | $12,870 |
Source: Public Records
Map
Nearby Homes
- -- Valley Pike
- - Valley Pike
- 2249 - Valley Pike
- 2301 Valley Pike
- 2460 Bushnell Ave
- 2249 Valley Pike
- 2249 Prince Albert Blvd
- 2245 Valley Pike
- 546 Wynora Ave
- 518 Tyron Ave
- - Rondowa Ave
- -- Rondowa Ave
- - Prince Albert Blvd
- -- Prince Albert Blvd
- 29 Barcelona Ave
- 641 Prince Albert Blvd
- 3586 Lane Garden Ct
- 1930 Brandt Pike
- 241 Community Dr
- 3322 Vagabond Ln
- 110 Rohrer Blvd
- 104 Rohrer Blvd
- 112 Rohrer Blvd
- 17 Winlock Ave
- 120 Rohrer Blvd
- 15 Winlock Ave
- 2502 Warrendale Ave
- 19 Winlock Ave
- 9 Winlock Ave
- 2512 Warrendale Ave
- 3 Winlock Ave
- 127 Rohrer Blvd
- 37 Winlock Ave
- 2501 Warrendale Ave
- 138 Rohrer Blvd
- 2524 Warrendale Ave
- 2497 Warrendale Ave
- 2513 Warrendale Ave
- 129 Rohrer Blvd
- 1 Pocatello Ave