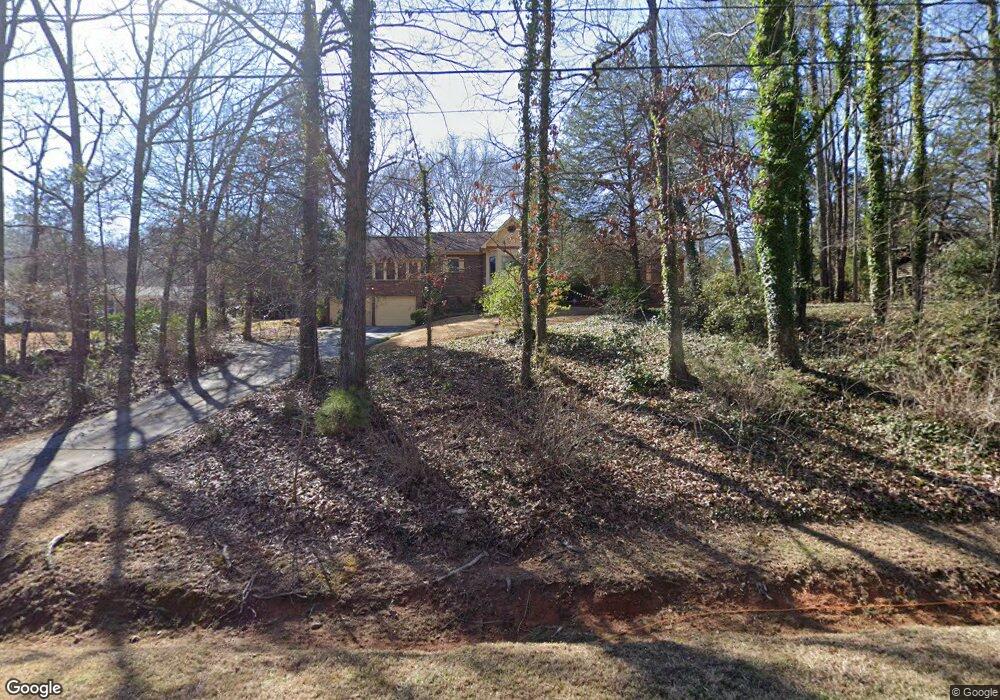
108 Southbrook Dr Griffin, GA 30224
Spalding County NeighborhoodEstimated Value: $310,721 - $349,000
3
Beds
2
Baths
2,339
Sq Ft
$142/Sq Ft
Est. Value
About This Home
This home is located at 108 Southbrook Dr, Griffin, GA 30224 and is currently estimated at $331,430, approximately $141 per square foot. 108 Southbrook Dr is a home located in Spalding County with nearby schools including Moreland Road Elementary School, Carver Road Middle School, and Spalding High School.
Ownership History
Date
Name
Owned For
Owner Type
Purchase Details
Closed on
May 31, 2012
Sold by
Lomonaco Marie E
Bought by
Bieniek James C
Current Estimated Value
Home Financials for this Owner
Home Financials are based on the most recent Mortgage that was taken out on this home.
Original Mortgage
$121,670
Outstanding Balance
$86,541
Interest Rate
4.4%
Mortgage Type
FHA
Estimated Equity
$244,889
Purchase Details
Closed on
Jun 15, 2009
Sold by
Lomonaco Rudolph P
Bought by
Lomonaco Marie E
Purchase Details
Closed on
Jan 1, 1986
Sold by
Raybon Otis Morris
Bought by
Lomonaco Rudolph and Lomonaco Marie
Purchase Details
Closed on
Jun 13, 1980
Sold by
Debenedittis Frances
Bought by
Raybon Otis Morris
Purchase Details
Closed on
Jun 1, 1979
Sold by
Barron Charles S and Barron Anna W
Bought by
Debenedittis Frances
Purchase Details
Closed on
Jun 9, 1978
Sold by
Wix Larry W and Wix Beth C
Bought by
Barron Charles S and Barron Anna W
Purchase Details
Closed on
Jan 31, 1978
Sold by
Jones Crossfield R and Jones Lenora C
Bought by
Wix Larry W and Wix Beth C
Create a Home Valuation Report for This Property
The Home Valuation Report is an in-depth analysis detailing your home's value as well as a comparison with similar homes in the area
Home Values in the Area
Average Home Value in this Area
Purchase History
| Date | Buyer | Sale Price | Title Company |
|---|---|---|---|
| Bieniek James C | $134,000 | -- | |
| Lomonaco Marie E | -- | -- | |
| Lomonaco Rudolph | $10,500 | -- | |
| Raybon Otis Morris | $7,100 | -- | |
| Debenedittis Frances | $6,500 | -- | |
| Barron Charles S | $6,400 | -- | |
| Wix Larry W | -- | -- |
Source: Public Records
Mortgage History
| Date | Status | Borrower | Loan Amount |
|---|---|---|---|
| Open | Bieniek James C | $121,670 |
Source: Public Records
Tax History Compared to Growth
Tax History
| Year | Tax Paid | Tax Assessment Tax Assessment Total Assessment is a certain percentage of the fair market value that is determined by local assessors to be the total taxable value of land and additions on the property. | Land | Improvement |
|---|---|---|---|---|
| 2024 | $3,145 | $93,468 | $13,200 | $80,268 |
| 2023 | $3,145 | $87,868 | $13,200 | $74,668 |
| 2022 | $2,589 | $76,684 | $12,000 | $64,684 |
| 2021 | $2,333 | $69,643 | $12,000 | $57,643 |
| 2020 | $2,321 | $69,078 | $12,000 | $57,078 |
| 2019 | $2,367 | $69,078 | $12,000 | $57,078 |
| 2018 | $2,369 | $63,808 | $12,000 | $51,808 |
| 2017 | $2,305 | $63,808 | $12,000 | $51,808 |
| 2016 | $2,346 | $63,808 | $12,000 | $51,808 |
| 2015 | $2,417 | $63,808 | $12,000 | $51,808 |
| 2014 | $2,465 | $63,808 | $12,000 | $51,808 |
Source: Public Records
Map
Nearby Homes
- 116 Southbrook Dr
- 15390 U S Highway 19 Hwy
- 219 Timber Wolf Trail
- 1117 Birchwood Dr
- 138 Townsend Ct
- 119 Townsend Ct
- 135 Townsend Ct
- 1317 Sycamore Cir
- 137 Townsend Dr
- 210 Hidden Falls Walk
- 120 Huntington Terrace
- 1200 White Oak Way
- 111 Huntington Terrace
- 1215 White Oak Way
- 7 Crabapple Cir
- 142 Williams Trail
- 0 Oak Grove Trial
- 21 Oak Grove Trail
- 105 Jewel Dr
- 490 County Line Rd
- 106 Southbrook Dr
- 110 Southbrook Dr Unit 20
- 110 Southbrook Dr
- 0 Southbrook Dr Unit 8697696
- 0 Southbrook Dr Unit 8568083
- 0 Southbrook Dr Unit 8514685
- 0 Southbrook Dr Unit 8063194
- 0 Southbrook Dr Unit 8181091
- 0 Southbrook Dr Unit 8512700
- 0 Southbrook Dr Unit 8395136
- 0 Southbrook Dr Unit 7574820
- 0 Southbrook Dr Unit 7015331
- 0 Southbrook Dr
- 112 Southbrook Dr
- 1790 Zebulon Rd
- 1796 Zebulon Rd
- 107 Southbrook Dr
- 1788 Zebulon Rd
- 111 Southbrook Dr
- 1800 Zebulon Rd