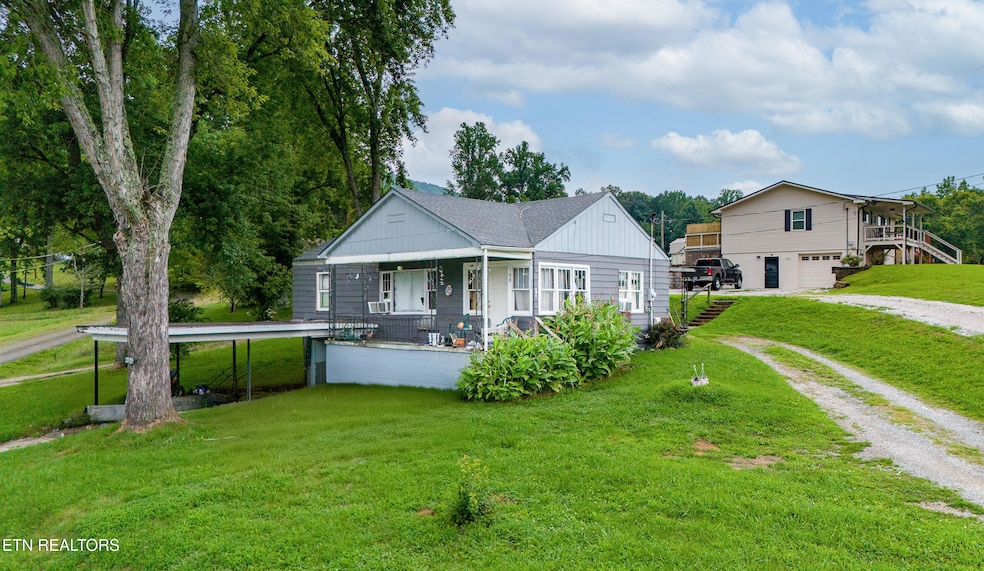
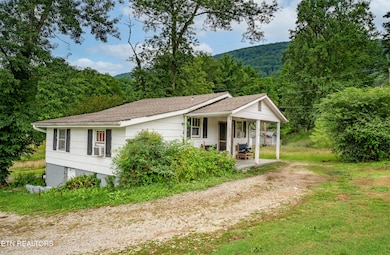
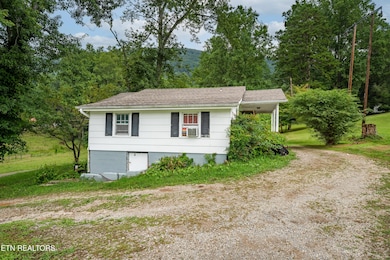
108 Zeni Ln Harriman, TN 37748
Estimated payment $1,488/month
About This Home
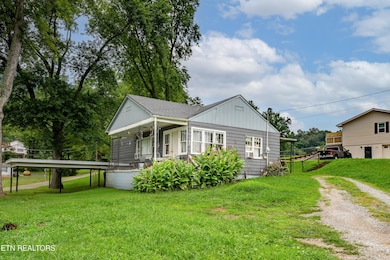
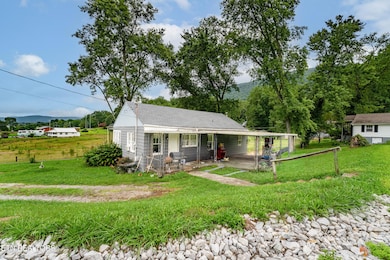
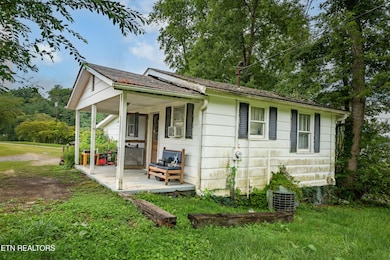
This portfolio contains 2 single family homes located on one lot in Harriman, TN. At full occupancy the potential gross monthly rent is $2,400. 108 Zeni Lane is a 3 bed /1 bath and 112 Zeni Lane is a 2 bed / 1 bath. There have been recent upgrades to the units including new windows, plumbing, and more. The properties are located near major employers and local retailers in Roane County.
Property Details
Home Type
- Multi-Family
Est. Annual Taxes
- $502
Year Built
- Built in 1955
Home Design
- Converted Dwelling
- Frame Construction
- Shingle Roof
Interior Spaces
- 1,536 Sq Ft Home
- Vinyl Flooring
Parking
- Gravel Driveway
- On-Site Parking
Utilities
- Central Heating and Cooling System
Community Details
- 2 Units
- Ridge View Subdivision
Listing and Financial Details
- Assessor Parcel Number 011N B 001.00
Map
Home Values in the Area
Average Home Value in this Area
Tax History
| Year | Tax Paid | Tax Assessment Tax Assessment Total Assessment is a certain percentage of the fair market value that is determined by local assessors to be the total taxable value of land and additions on the property. | Land | Improvement |
|---|---|---|---|---|
| 2024 | $502 | $20,900 | $2,150 | $18,750 |
| 2023 | $502 | $20,900 | $2,150 | $18,750 |
| 2022 | $502 | $20,900 | $2,150 | $18,750 |
| 2021 | $516 | $20,900 | $2,150 | $18,750 |
| 2020 | $516 | $20,900 | $2,150 | $18,750 |
| 2019 | $548 | $20,425 | $2,000 | $18,425 |
| 2018 | $526 | $20,425 | $2,000 | $18,425 |
| 2017 | $526 | $20,425 | $2,000 | $18,425 |
| 2016 | $526 | $20,425 | $2,000 | $18,425 |
| 2015 | $526 | $20,425 | $2,000 | $18,425 |
| 2013 | -- | $21,575 | $2,025 | $19,550 |
Property History
| Date | Event | Price | List to Sale | Price per Sq Ft |
|---|---|---|---|---|
| 11/13/2025 11/13/25 | For Sale | $275,000 | -- | $179 / Sq Ft |
Purchase History
| Date | Type | Sale Price | Title Company |
|---|---|---|---|
| Deed | $45,000 | -- | |
| Warranty Deed | $45,500 | -- | |
| Deed | -- | -- |
Source: East Tennessee REALTORS® MLS
MLS Number: 1321744
APN: 011N-B-001.00
Disclaimer: Certain information contained herein is derived from information provided by parties other than Homes.com. All information provided is deemed reliable, but is not guaranteed to be accurate and should be independently verified.
![]() IDX information is provided exclusively for personal, non-commercial use, and may not be used for any purpose other than to identify prospective properties consumers may be interested in purchasing. Information is deemed reliable but not guaranteed.
IDX information is provided exclusively for personal, non-commercial use, and may not be used for any purpose other than to identify prospective properties consumers may be interested in purchasing. Information is deemed reliable but not guaranteed.
Listing Information presented by local MLS brokerage: Ten-X, LLC dba Homes.com, local broker - Arlene Richardson - 888-952-6393.
- 104 Azalea Cir
- 105 Meadowlark Dr
- 126 Woods Chapel Rd
- 376 N Rolling Meadows Dr
- 382 N Rolling Meadows Dr
- 388 N Rolling Meadows Dr
- 226 N Rolling Meadows Dr
- 206 N Rolling Meadows Dr
- 196 N Rolling Meadows Dr
- 197 N Rolling Meadows Dr
- 187 N Rolling Meadows Dr
- 177 N Rolling Meadows Dr
- 132 N Rolling Meadows Dr
- 127 N Rolling Meadows Dr
- 122 N Rolling Meadows Dr
- 117 N Rolling Meadows Dr
- 107 N Rolling Meadows Dr
- 216 N Rolling Meadows Dr
- 192 N Blissful Meadows Dr
- 212 Morning Dr Unit A2
- 212 Morning Dr Unit 1
- 517 Cumberland St
- 430 N Roane St
- 428 N Roane St
- 420 N Roane St Unit 7
- 420 N Roane St Unit 5
- 406 Clifty St
- 1200 River Oaks Dr
- 2523 Old Harriman Hwy
- 1112 Dogwood Dr
- 130 Hardinberry St
- 309 Hobson Rd
- 4566 Knoxville Hwy Unit 1
- 626 Lawnville Rd Unit 5
- 626 Lawnville Rd Unit 4
- 329 Bailey Rd
- 319 Bailey Rd Unit 8
- 137 Old James Ferry Rd
- 2834 Lake Pointe Dr
