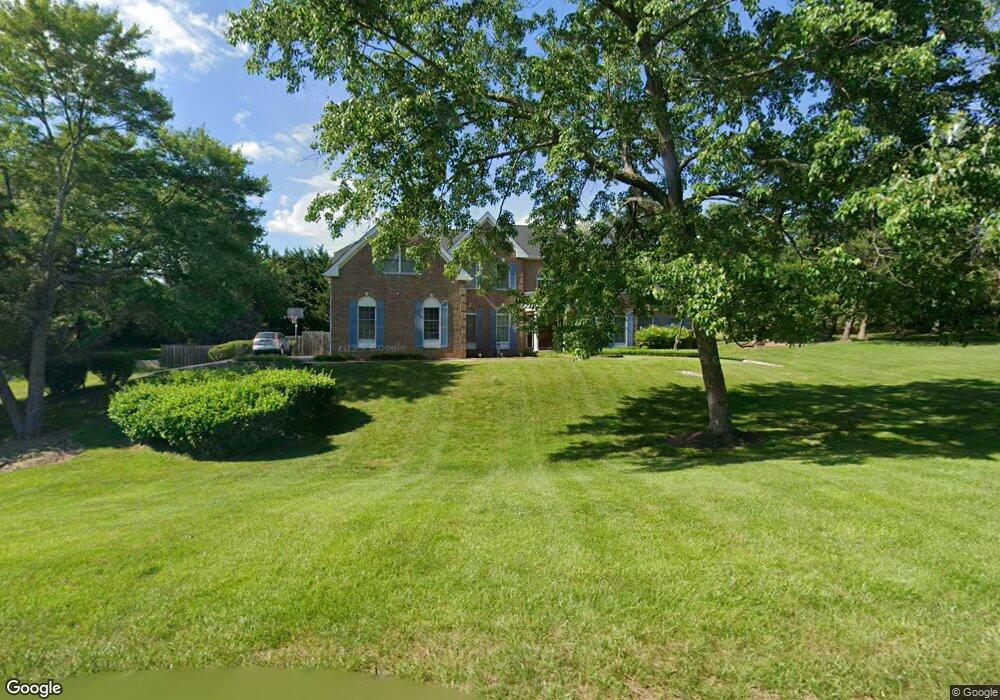
10800 Fournier Dr Fairfax Station, VA 22039
Estimated Value: $1,397,929 - $1,462,000
4
Beds
3
Baths
4,254
Sq Ft
$338/Sq Ft
Est. Value
About This Home
This home is located at 10800 Fournier Dr, Fairfax Station, VA 22039 and is currently estimated at $1,437,310, approximately $337 per square foot. 10800 Fournier Dr is a home located in Fairfax County with nearby schools including Fairview Elementary School, James W Robinson, Jr. Secondary School, and Fairfax Baptist Temple Academy.
Ownership History
Date
Name
Owned For
Owner Type
Purchase Details
Closed on
Jun 30, 2005
Sold by
Cho Woon Sang
Bought by
Rahimi Abdul Farid
Current Estimated Value
Home Financials for this Owner
Home Financials are based on the most recent Mortgage that was taken out on this home.
Original Mortgage
$650,000
Outstanding Balance
$340,841
Interest Rate
5.73%
Mortgage Type
New Conventional
Estimated Equity
$1,096,469
Purchase Details
Closed on
Apr 4, 1997
Sold by
Eubanks William and Eubanks Charisse E
Bought by
Cho Woon Sang and Cho Soon Duk
Home Financials for this Owner
Home Financials are based on the most recent Mortgage that was taken out on this home.
Original Mortgage
$359,200
Interest Rate
7.5%
Mortgage Type
New Conventional
Purchase Details
Closed on
May 12, 1995
Sold by
Fairfax Station Hunt Lp
Bought by
Eubanks William
Home Financials for this Owner
Home Financials are based on the most recent Mortgage that was taken out on this home.
Original Mortgage
$399,650
Interest Rate
8.31%
Create a Home Valuation Report for This Property
The Home Valuation Report is an in-depth analysis detailing your home's value as well as a comparison with similar homes in the area
Home Values in the Area
Average Home Value in this Area
Purchase History
| Date | Buyer | Sale Price | Title Company |
|---|---|---|---|
| Rahimi Abdul Farid | $999,000 | -- | |
| Cho Woon Sang | $449,000 | -- | |
| Eubanks William | $500,633 | -- |
Source: Public Records
Mortgage History
| Date | Status | Borrower | Loan Amount |
|---|---|---|---|
| Open | Rahimi Abdul Farid | $650,000 | |
| Previous Owner | Eubanks William | $359,200 | |
| Previous Owner | Eubanks William | $399,650 |
Source: Public Records
Tax History Compared to Growth
Tax History
| Year | Tax Paid | Tax Assessment Tax Assessment Total Assessment is a certain percentage of the fair market value that is determined by local assessors to be the total taxable value of land and additions on the property. | Land | Improvement |
|---|---|---|---|---|
| 2021 | $10,841 | $923,860 | $350,000 | $573,860 |
| 2020 | $10,934 | $923,860 | $350,000 | $573,860 |
| 2019 | $10,867 | $918,180 | $350,000 | $568,180 |
| 2018 | $10,588 | $894,630 | $343,000 | $551,630 |
| 2017 | $10,715 | $922,880 | $360,000 | $562,880 |
| 2016 | $10,692 | $922,880 | $360,000 | $562,880 |
| 2015 | $10,081 | $903,330 | $360,000 | $543,330 |
| 2014 | $10,059 | $903,330 | $360,000 | $543,330 |
Source: Public Records
Map
Nearby Homes
- 6220 Winslow Ct
- 6305 Barsky Ct
- 5816 Oak Leather Dr
- 10848 Burr Oak Way
- 10911 Carters Oak Way
- 6408 Jumet Ct
- 5900 Carters Oak Ct
- 5879 Jacksons Oak Ct
- 6154 Martins Landing Ct
- 6115 Martins Landing Ct
- 11019 Clara Barton Dr
- 5918 Cove Landing Rd Unit 204
- 5703 Oak Stake Ct
- 5932 Cove Landing Rd Unit 101
- 10676 Myrtle Oak Ct
- 5837 Cove Landing Rd Unit 101
- 5806 Cove Landing Rd Unit 304
- 5826 Hannora Ln
- 5674 Oak Tanager Ct
- 6645 Rutledge Dr
- 10803 Fournier Dr
- 6184 Freds Oak Rd
- 10804 Fournier Dr
- 10726 Fournier Dr
- 6100 Freds Oak Rd
- 6183 Freds Oak Rd
- 10720 Fournier Dr
- 6190 Freds Oak Rd
- 6187 Freds Oak Rd
- 6209 Sydney Rd
- 10721 Fournier Dr
- 6205 Sydney Rd
- 6196 Freds Oak Rd
- 6211 Sydney Rd
- 6191 Freds Oak Rd
- 6201 Sydney Rd
- 6200 Freds Oak Rd
- 6215 Sydney Rd
- 5935 Freds Oak Rd
- 10715 Fournier Dr